

Question: 1. (1) Start with the Matlab listing for the 6 differential equation CV model. Run the model for normal Emaxl (3) and plot left ventricular

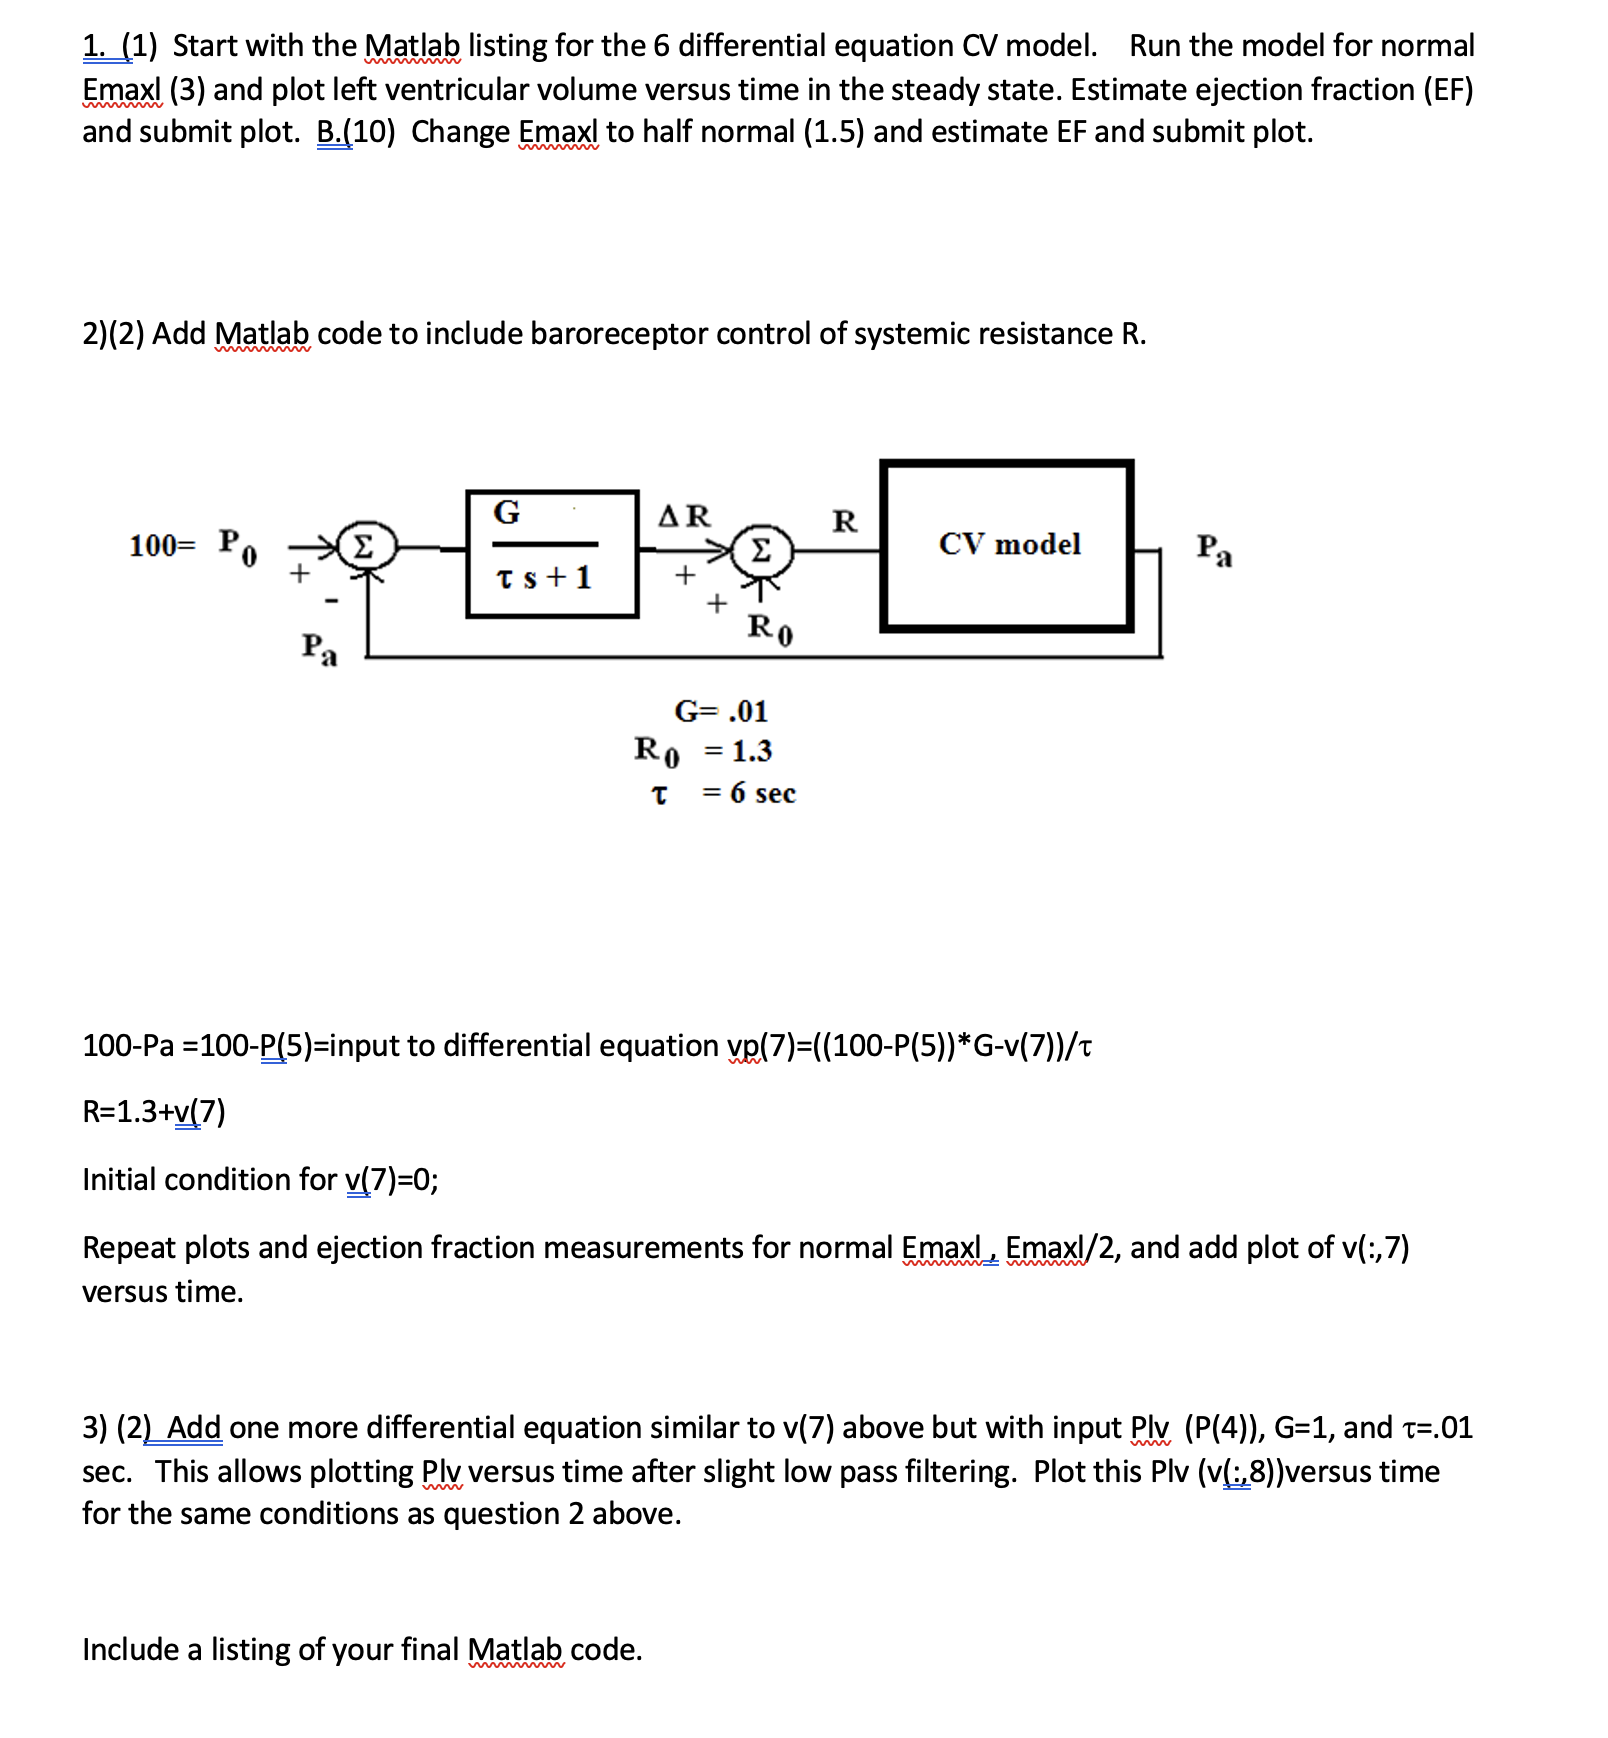
1. (1) Start with the Matlab listing for the 6 differential equation CV model. Run the model for normal Emaxl (3) and plot left ventricular volume versus time in the steady state. Estimate ejection fraction (EF) and submit plot. B.(10) Change Emaxl to half normal (1.5) and estimate EF and submit plot. 2)(2) Add Matlab code to include baroreceptor control of systemic resistance R. G AR R 100= Po CV model Pa ts+1 + + Ro Pa G=.01 Ro I = 6 sec 100-Pa =100-P(5)=input to differential equation vp(7)=((100-P(5)) *G-v(7))/t R=1.3+v(7) Initial condition for v(7)=0; Repeat plots and ejection fraction measurements for normal Emaxl , Emaxl/2, and add plot of v(:, 7) versus time. 3) (2) Add one more differential equation similar to v(7) above but with input Ply (P(4)), G=1, and t=.01 sec. This allows plotting Ply versus time after slight low pass filtering. Plot this Plv (v(:,8))versus time for the same conditions as question 2 above. Include a listing of your final Matlab code
Step by Step Solution
There are 3 Steps involved in it

Get step-by-step solutions from verified subject matter experts