

Question: A continuous-time signal x(t) is sampled at 1000 samples/second with negligible aliasing. You use its samples to compute its spectrogram using the FFT at
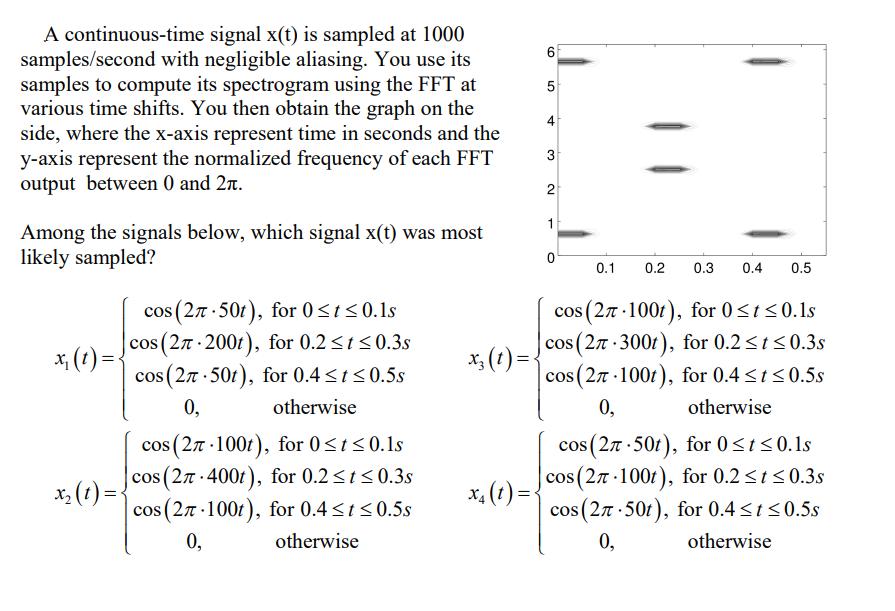
A continuous-time signal x(t) is sampled at 1000 samples/second with negligible aliasing. You use its samples to compute its spectrogram using the FFT at various time shifts. You then obtain the graph on the side, where the x-axis represent time in seconds and the y-axis represent the normalized frequency of each FFT output between 0 and 2. Among the signals below, which signal x(t) was most likely sampled? 5 4 cos (27-501), for 0t0.1s x(t)= cos (27-2001), for 0.210.3s cos (27-50t), for 0.4
Step by Step Solution
★★★★★
3.46 Rating (146 Votes )
There are 3 Steps involved in it
1 Expert Approved Answer
Step: 1 Unlock

Question Has Been Solved by an Expert!
Get step-by-step solutions from verified subject matter experts
Step: 2 Unlock
Step: 3 Unlock