

Question: 1) (10 points) Consider the US population growth data xt from Module 1.2 a) Define yt=xt=xtLxt=xtxt1.compute and plot (ytVs.t). Do you see a trend from
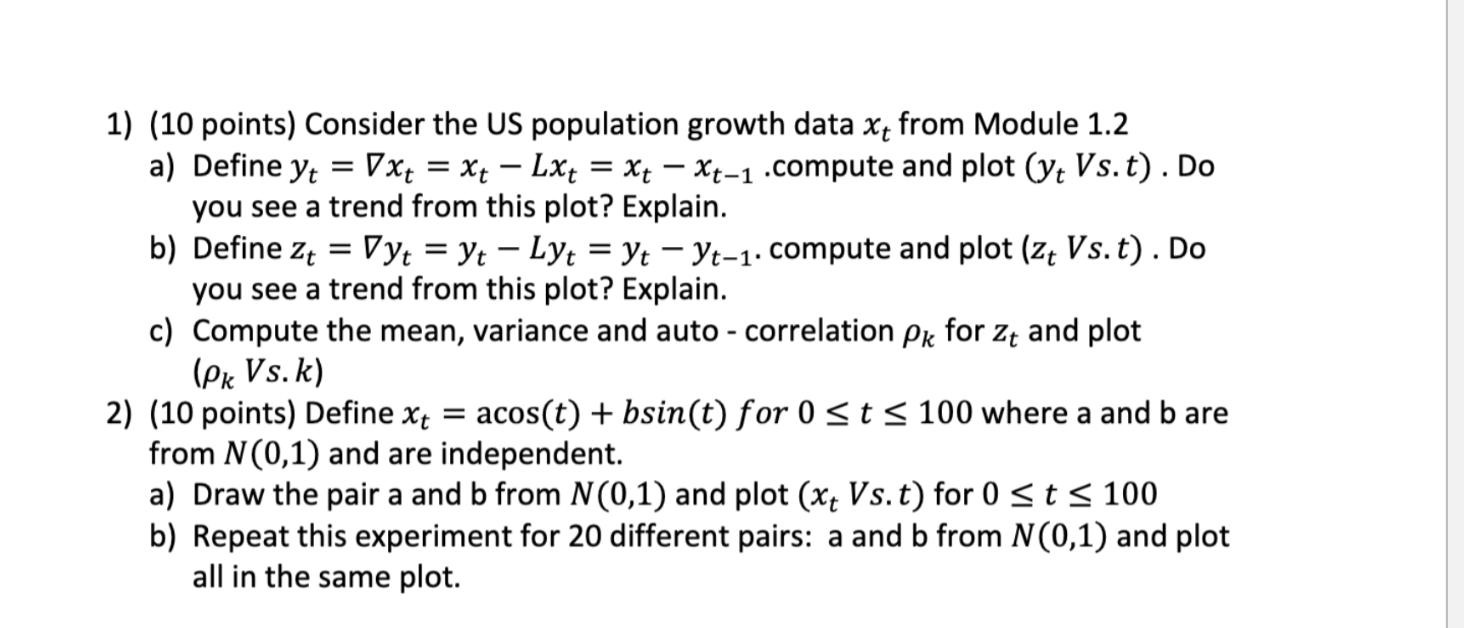
1) (10 points) Consider the US population growth data xt from Module 1.2 a) Define yt=xt=xtLxt=xtxt1.compute and plot (ytVs.t). Do you see a trend from this plot? Explain. b) Define zt=yt=ytLyt=ytyt1. compute and plot (ztVs.t). Do you see a trend from this plot? Explain. c) Compute the mean, variance and auto - correlation k for zt and plot (kVs.k) 2) (10 points) Define xt=acos(t)+bsin(t) for 0t100 where a and b are from N(0,1) and are independent. a) Draw the pair a and b from N(0,1) and plot ( xtVs.t) for 0t100 b) Repeat this experiment for 20 different pairs: a and b from N(0,1) and plot all in the same plot
Step by Step Solution
There are 3 Steps involved in it
1 Expert Approved Answer
Step: 1 Unlock

Question Has Been Solved by an Expert!
Get step-by-step solutions from verified subject matter experts
Step: 2 Unlock
Step: 3 Unlock