

Question: 1 (10 pts.) Complete Spreadsheet Exercise 6.1. Note I made a slight change in part b. 6.1 Warren Buffett, arguably the most famous investor in
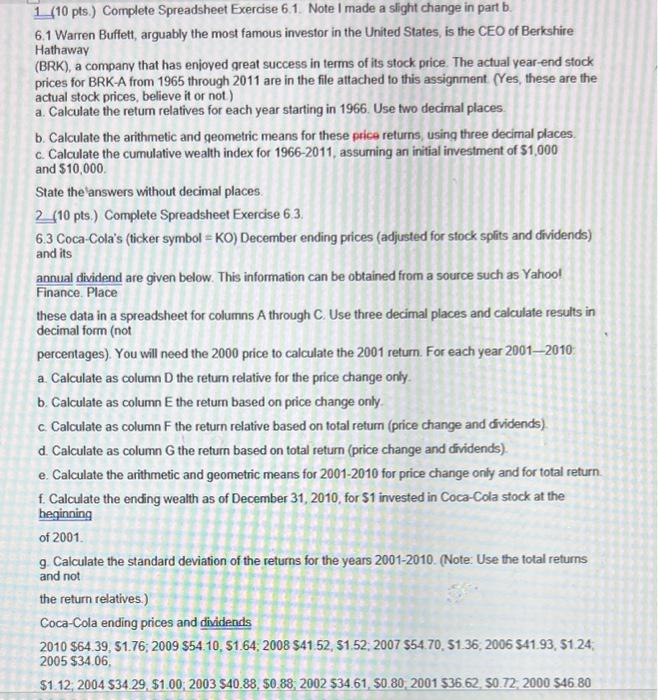
1 (10 pts.) Complete Spreadsheet Exercise 6.1. Note I made a slight change in part b. 6.1 Warren Buffett, arguably the most famous investor in the United States, is the CEO of Berkshire Hathaway (BRK), a company that has enjoved great success in terms of its stock price. The actual year-end stock prices for BRK-A from 1965 through 2011 are in the file attached to this assignment (Yes, these are the actual stock prices, believe it or not.) a. Calculate the retum relatives for each year starting in 1966. Use two decimal places. b. Calculate the arithmetic and qeometric means for these price returns, using three decimal places. c. Calculate the cumulative wealth index for 1966-2011, assuming an initial investment of $1,000 and $10,000. State the 'answers without decimal places. 2 (10 pts.) Complete Spreadsheet Exercise 6.3. 6.3 Coca-Cola's (ticker symbol = KO) December ending prices (adjusted for stock splits and dividends) and its annual dividend are given below. This information can be obtained from a source such as Yahoot Finance. Place these data in a spreadsheet for columns A through C. Use three decimal places and calculate results in decimal form (not percentages). You will need the 2000 price to calculate the 2001 return. For each year 2001-2010: a. Calculate as column D the return relative for the price change only. b. Calculate as column E the return based on price change only. c. Calculate as column F the return relative based on total retum (price change and dividends) d. Calculate as column G the return based on total return (price change and dividends) e. Calculate the arithmetic and geometric means for 2001-2010 for price change only and for total return. f. Calculate the ending wealth as of December 31, 2010, for $1 invested in Coca-Cola stock at the heginning of 2001 9. Calculate the standard deviation of the returns for the years 2001-2010. (Note: Use the total returns and not the return relatives.) Coca-Cola ending prices and dividends 2010$64.39,$1.76;2009$54.10,$1.64;2008$41.52,$1.52;2007$54.70,$1.36;2006$41.93,$1.24;2005$34.06,$1.12;2004$34.29,$1.00;2003$40.88,$0.88,2002$34.61,$0.80,2001$36.62,$0.72,2000$46.80 1 (10 pts.) Complete Spreadsheet Exercise 6.1. Note I made a slight change in part b. 6.1 Warren Buffett, arguably the most famous investor in the United States, is the CEO of Berkshire Hathaway (BRK), a company that has enjoved great success in terms of its stock price. The actual year-end stock prices for BRK-A from 1965 through 2011 are in the file attached to this assignment (Yes, these are the actual stock prices, believe it or not.) a. Calculate the retum relatives for each year starting in 1966. Use two decimal places. b. Calculate the arithmetic and qeometric means for these price returns, using three decimal places. c. Calculate the cumulative wealth index for 1966-2011, assuming an initial investment of $1,000 and $10,000. State the 'answers without decimal places. 2 (10 pts.) Complete Spreadsheet Exercise 6.3. 6.3 Coca-Cola's (ticker symbol = KO) December ending prices (adjusted for stock splits and dividends) and its annual dividend are given below. This information can be obtained from a source such as Yahoot Finance. Place these data in a spreadsheet for columns A through C. Use three decimal places and calculate results in decimal form (not percentages). You will need the 2000 price to calculate the 2001 return. For each year 2001-2010: a. Calculate as column D the return relative for the price change only. b. Calculate as column E the return based on price change only. c. Calculate as column F the return relative based on total retum (price change and dividends) d. Calculate as column G the return based on total return (price change and dividends) e. Calculate the arithmetic and geometric means for 2001-2010 for price change only and for total return. f. Calculate the ending wealth as of December 31, 2010, for $1 invested in Coca-Cola stock at the heginning of 2001 9. Calculate the standard deviation of the returns for the years 2001-2010. (Note: Use the total returns and not the return relatives.) Coca-Cola ending prices and dividends 2010$64.39,$1.76;2009$54.10,$1.64;2008$41.52,$1.52;2007$54.70,$1.36;2006$41.93,$1.24;2005$34.06,$1.12;2004$34.29,$1.00;2003$40.88,$0.88,2002$34.61,$0.80,2001$36.62,$0.72,2000$46.80
Step by Step Solution
There are 3 Steps involved in it

Get step-by-step solutions from verified subject matter experts