

Question: 1. [11 points} A study examined language acquisition in learning~impaired children. The researcher designed two computer modules that taught children the same content but used
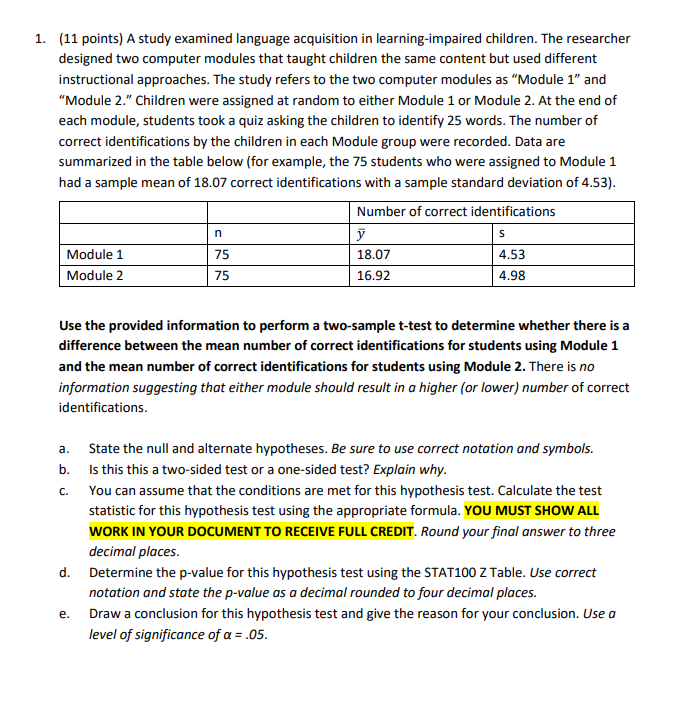
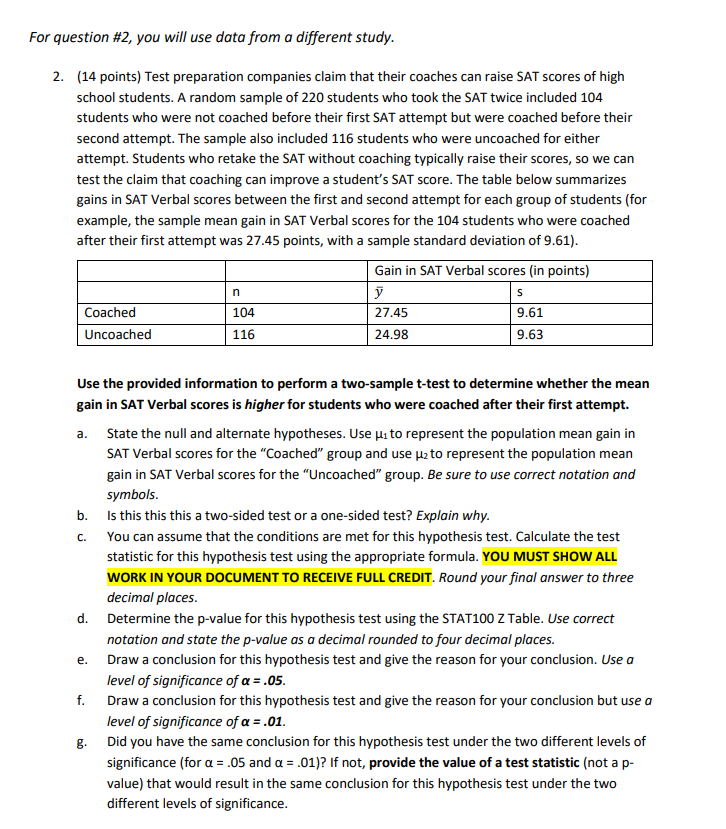
1. [11 points} A study examined language acquisition in learning~impaired children. The researcher designed two computer modules that taught children the same content but used different instructional approaches. The study refers to the two computer modules as "Module 1\" and "Module 1.\" Children were assigned at random to either Module 1 or Module 2. At the end of each module, students took a quiz asking the children to identify 25 words. The number of correct identications by the children in each Module group were recorded. Data are summarized in the table below [for example. the ?5 students who were assigned to Module 1 had a sample mean of 131}? correct identications with a sample standard deviation of 4.53}. Use the provided information to perform a two-sample tvtest to determine whether there is a difference between the mean number of correct identications for students using Module 1 and the mean number of correct identications for students using Module 1. There is no information suggesting that either moduie shauid result in a higher for iowerj number of correct identifications. a. State the null and alternate hypotheses. Be sure to use correct notation and symbols. b. Is this this a two~sided test or a one~sided test? Expiain why. c. iron can assume that the conditions are met for this hypothesis test. Calculate the test statistic for this hypothesis test using the appropriate formula. 'I'DLI MUST SHOW ALL WORK IN "I'I'JLIR DOCUMENT TO RECEIVE FULL CREDIT. itound yourjinai answer to three decimai places. d. Determine the pyalue for this hypothesis test using the STATED E Table. Use correct notation and state the omlue as a decimal rounded to Jtour decimai piaces. e. Draw a conclusion for this hypothesis test and give the reason for your conclusion. Use a ieyei of signicance of a = .05. For question #2, you wiii use data from a di'erent study. 2. [14 points} Test preparation companies claim that their coaches can raise SAT scores of high school students. A random sample of 22:] students who tool: the SAT twice included 104 students who were not coached before their first SAT attempt but were coached before their second attempt. The sample also included 115 students who were uncoached for either attempt. Students who retake the SAT without coaching typically raise their scores. so we can test the claim that coaching can improve a student's SAT score. The table below summarizes gains in SAT 1|.ierbal scores between the rst and second attempt for each group of students [for example. the sample mean gain in SAT 1v'ert'ial scores for the 1m students who were coached after their rst attempt was 2145 points, with a sample standard deviation of 9.51]. Gain insmemansmres in points: __ Unwashed _ Use the provided information to perform a two-sample tvtest to determine whether the mean gain in SAT Verbal scores is higherfor students who were coached after their rst attempt. a. State the null and alternate hypotheses. Use p1 to represent the population mean gain in SAT 1v'erb-al scores for the "Coached\" group and use pato represent the population mean gain in SAT 'iierbal scores for the "Uncoached" group. He sure to use correct notation and symbois. b. Is this this this a twosided test or a onessided test? Expiain why. c. You can assume that the conditions are met for this hypothesis test. Calculate the test statistic for this hypothesis test using the appropriate formula. 'I'DLI MUST SHOW ALL WORK IN "I'I'JLIR DOCUMENT TO RECEIVE FULL CREDIT. Round yournai answer to three decimai places. d. Determine the pwalue for this hypothesis test using the STATIDD 2 Table. Use correct notation and state the dvol'ue as a decimal rounded to four decimai pieces. e. Draw a conclusion for this hypothesis test and give the reason for your conclusion. Use a ievei of signicance of o = .55. f. Draw a conclusion for this hypothesis test and give the reason for your conclusion but use a ievei of signicance afo = .dl. g. Did you have the same conclusion for this hypothesis test under the two different levels of signicance {for a = .05 and t1 = .01}? If not, provide the value of a test statistic [not a p value] that would result in the same conclusion for this hypothesis test under the two different levels of significance
Step by Step Solution
There are 3 Steps involved in it

Get step-by-step solutions from verified subject matter experts