

Question: 1. (12 Points) a) Add four additional metrics (columns) into your data using the formula provided: 1. total_trips = trips_pool + trips_express; 2. cost_per_trip =
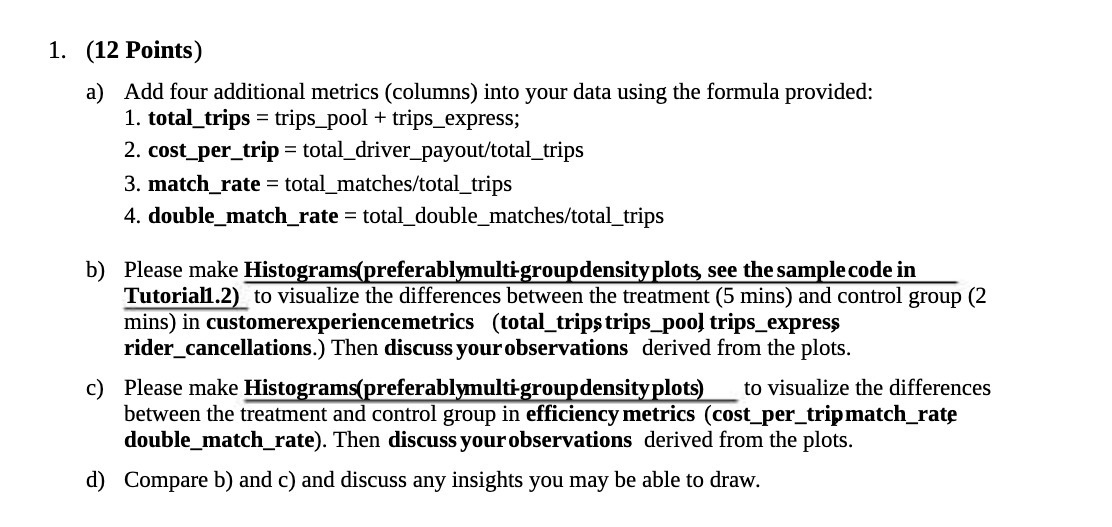

1. (12 Points) a) Add four additional metrics (columns) into your data using the formula provided: 1. total_trips = trips_pool + trips_express; 2. cost_per_trip = total_driver_payout/total_trips 3. match_rate = total_matches/total_trips 4. double_match_rate = total_double_matches/total_trips b) Please make Histograms(preferablymulti-groupdensityplots, see the sample code in Tutoriall.2) to visualize the differences between the treatment (5 mins) and control group (2 mins) in customerexperiencemetrics (total_trips trips_poo] trips_express rider_cancellations.) Then discuss your observations derived from the plots. c) Please make Histograms(preferablymulti-group density plots) to visualize the differences between the treatment and control group in efficiency metrics (cost_per_tripmatch_rate double_match_rate). Then discuss your observations derived from the plots. d) Compare b) and c) and discuss any insights you may be able to draw
Step by Step Solution
There are 3 Steps involved in it

Get step-by-step solutions from verified subject matter experts