

Question: 1. (12 points) The stem plot below displays midterm exam scores for the 31 students taking an Introductory Statistics course. The highest possible test score
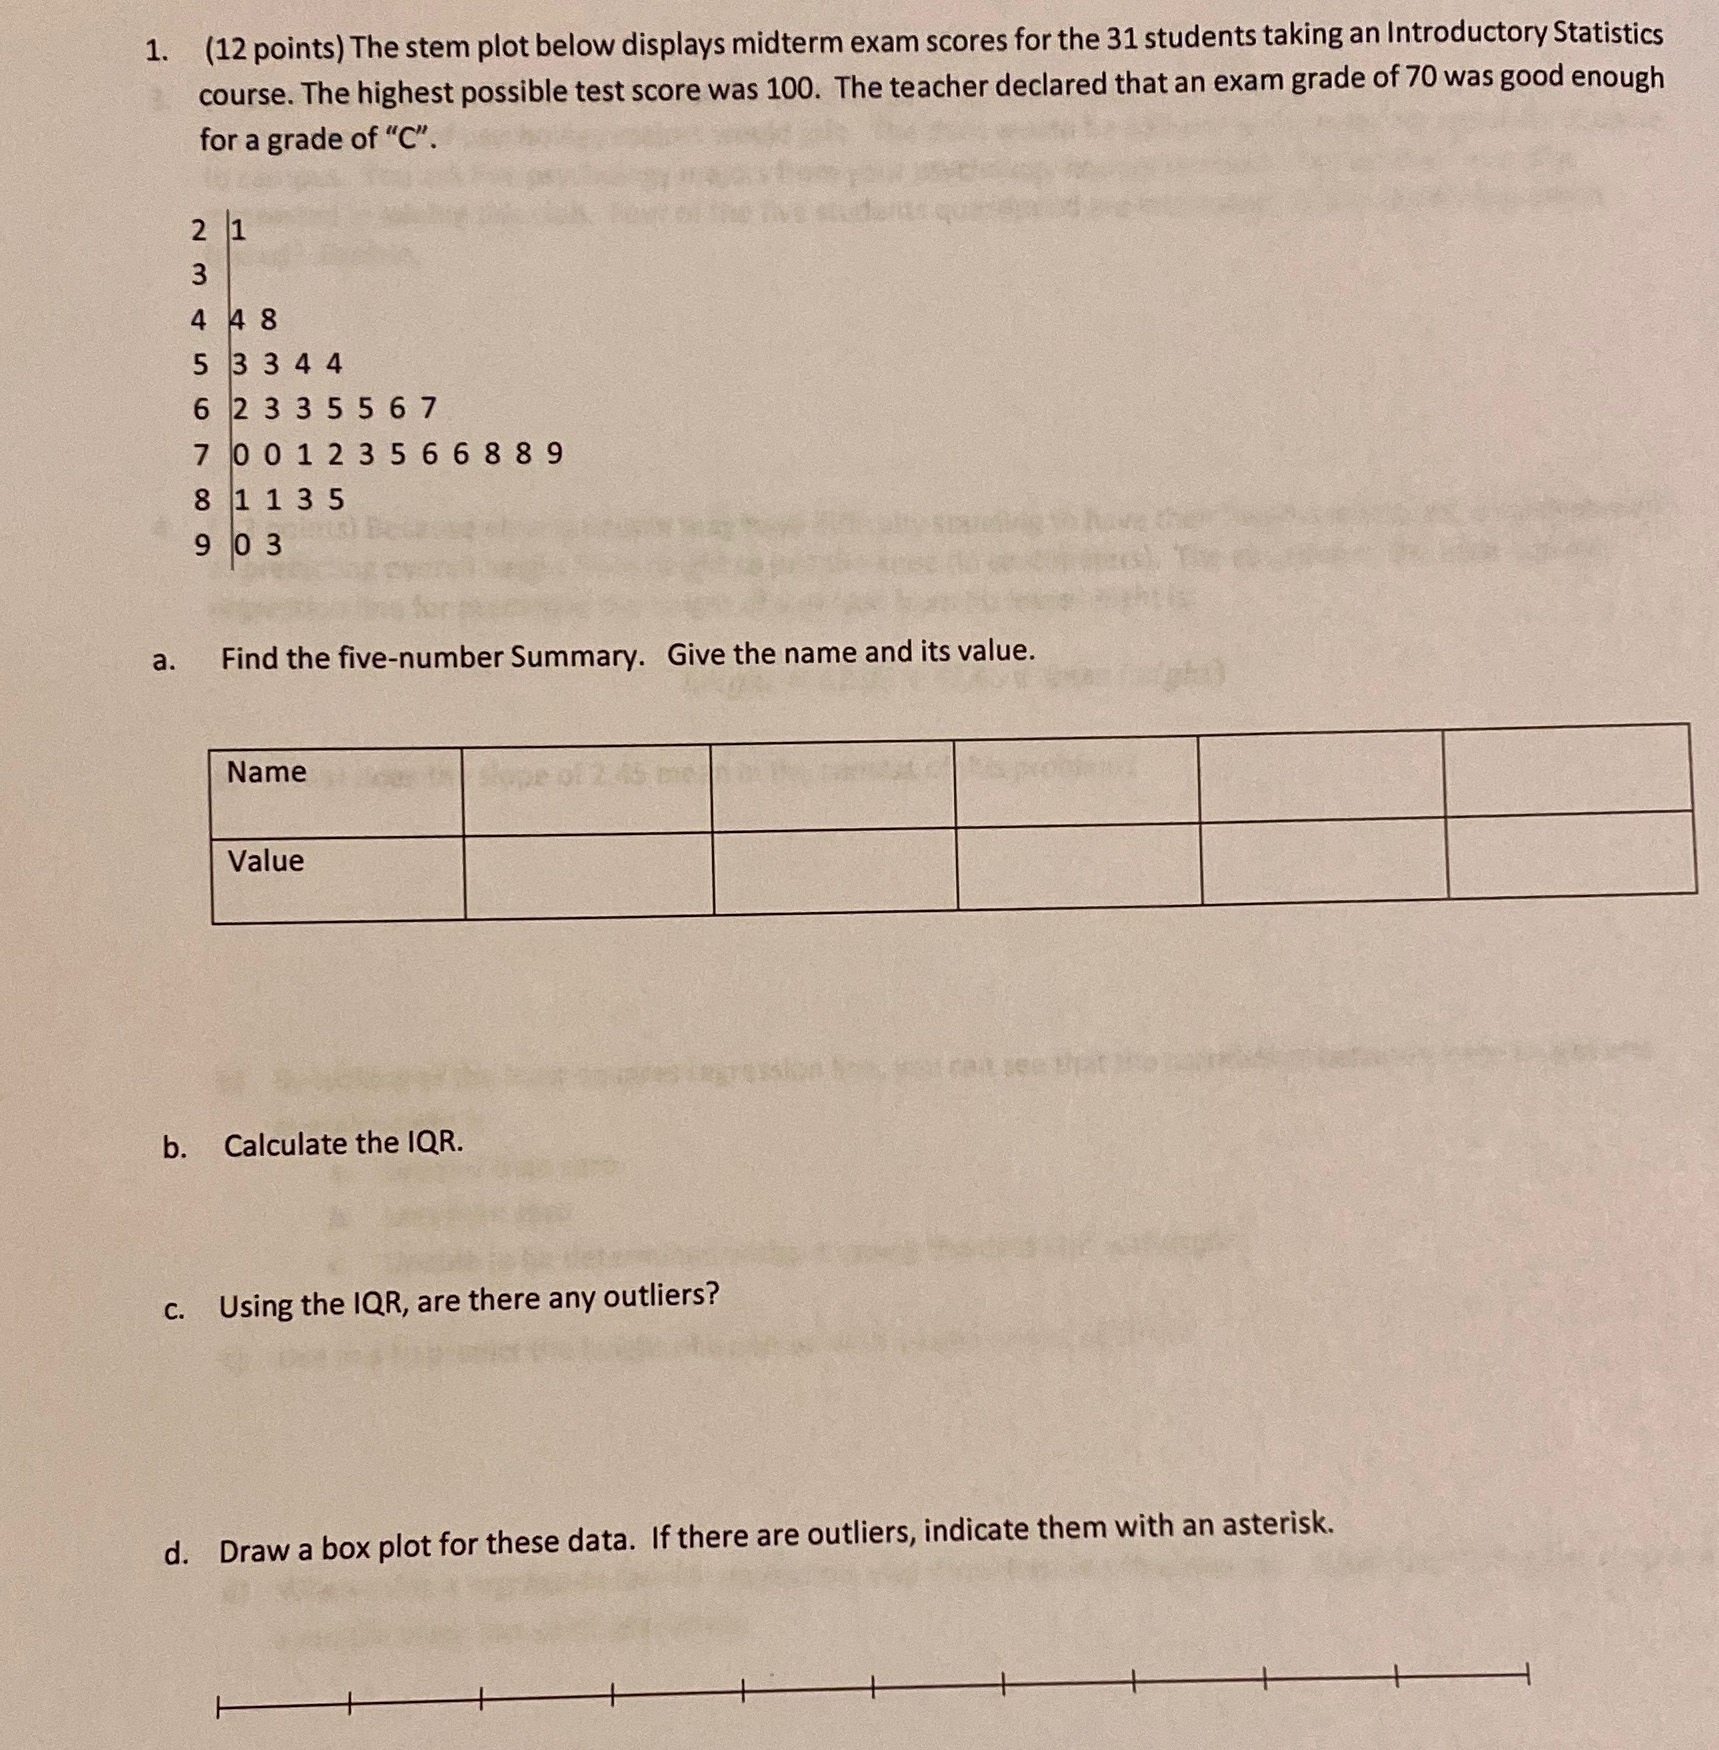
1. (12 points) The stem plot below displays midterm exam scores for the 31 students taking an Introductory Statistics course. The highest possible test score was 100. The teacher declared that an exam grade of 70 was good enough for a grade of "C". 2 1 3 4 4 8 5 3 3 4 4 6 2 3 3 5 5 6 7 7 0 012 356 6889 8 1 13 5 0 3 a. Find the five-number Summary. Give the name and its value. Name Value b. Calculate the IQR. c. Using the IQR, are there any outliers? d. Draw a box plot for these data. If there are outliers, indicate them with an asterisk
Step by Step Solution
There are 3 Steps involved in it
1 Expert Approved Answer
Step: 1 Unlock

Question Has Been Solved by an Expert!
Get step-by-step solutions from verified subject matter experts
Step: 2 Unlock
Step: 3 Unlock