

Question: 1. (14 Points) Given the following difference equation, determine the transfer function (H(z)), plot the frequency response (i.e., magnitude and phase responses) using freqz with
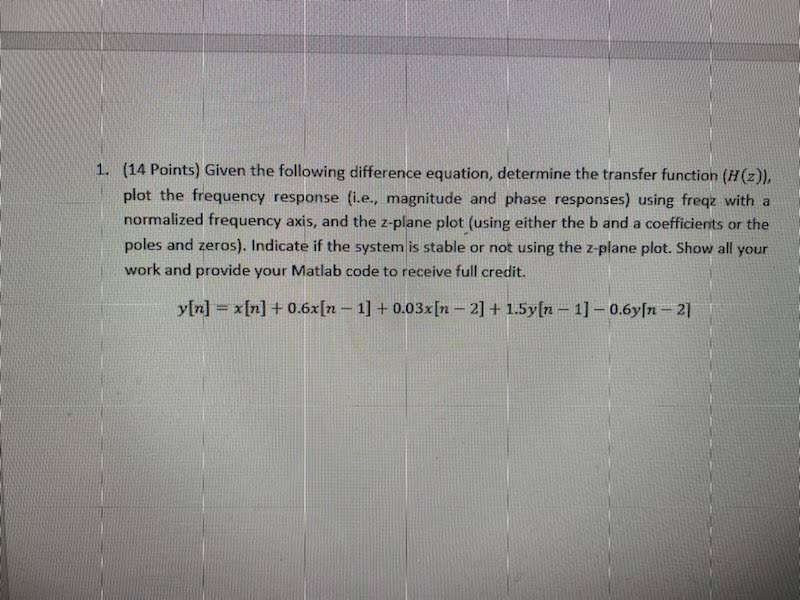
1. (14 Points) Given the following difference equation, determine the transfer function (H(z)), plot the frequency response (i.e., magnitude and phase responses) using freqz with a normalized frequency axis, and the z-plane plot (using either the band a coefficients or the poles and zeros). Indicate if the system is stable or not using the 2-plane plot. Show all your work and provide your Matlab code to receive full credit. y[n] = x[n] + 0.6x[n - 1] +0.03x[n -2] + 1.5y[n - 1] -0.6yn - 21
Step by Step Solution
There are 3 Steps involved in it
1 Expert Approved Answer
Step: 1 Unlock

Question Has Been Solved by an Expert!
Get step-by-step solutions from verified subject matter experts
Step: 2 Unlock
Step: 3 Unlock