

Question: 1 [14 pts] Let S = S(t) the function giving the sales (in million of dollars) of a major business after t years since the
![1 [14 pts] Let S = S(t) the function giving the](https://s3.amazonaws.com/si.experts.images/answers/2024/06/66738697e01a3_12766738697b2176.jpg)
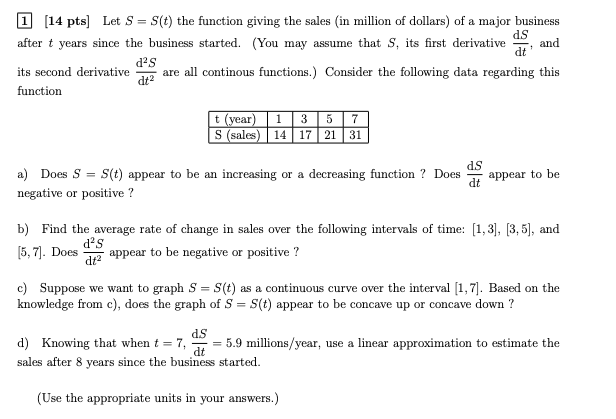
1 [14 pts] Let S = S(t) the function giving the sales (in million of dollars) of a major business after t years since the business started. (You may assume that S, its first derivative dS dt and d's its second derivative d+2 are all continous functions.) Consider the following data regarding this function t (year) 1 3 5 7 S (sales) 14 17 21 31 a) Does 5 = S(t) appear to be an increasing or a decreasing function ? Does dS dt appear to be negative or positive ? b) Find the average rate of change in sales over the following intervals of time: [1, 3], [3, 5], and [5, 7). Does d's de2 appear to be negative or positive ? c) Suppose we want to graph S = S(t) as a continuous curve over the interval (1, 7). Based on the knowledge from c), does the graph of S = S(t) appear to be concave up or concave down ? ds d) Knowing that when t = 7, = 5.9 millions/year, use a linear approximation to estimate the sales after 8 years since the business started. (Use the appropriate units in your answers.)
Step by Step Solution
There are 3 Steps involved in it

Get step-by-step solutions from verified subject matter experts