

Question: 1 2 0 4 DIMENSION REDUCTION FIGURE 4 . 5 SCATTER PLOT OF THE SECOND VS . FIRST PRINCIPAL COMPONENTS SCORES FOR THE NORMALIZED BREAKFAST
DIMENSION REDUCTION
FIGURE
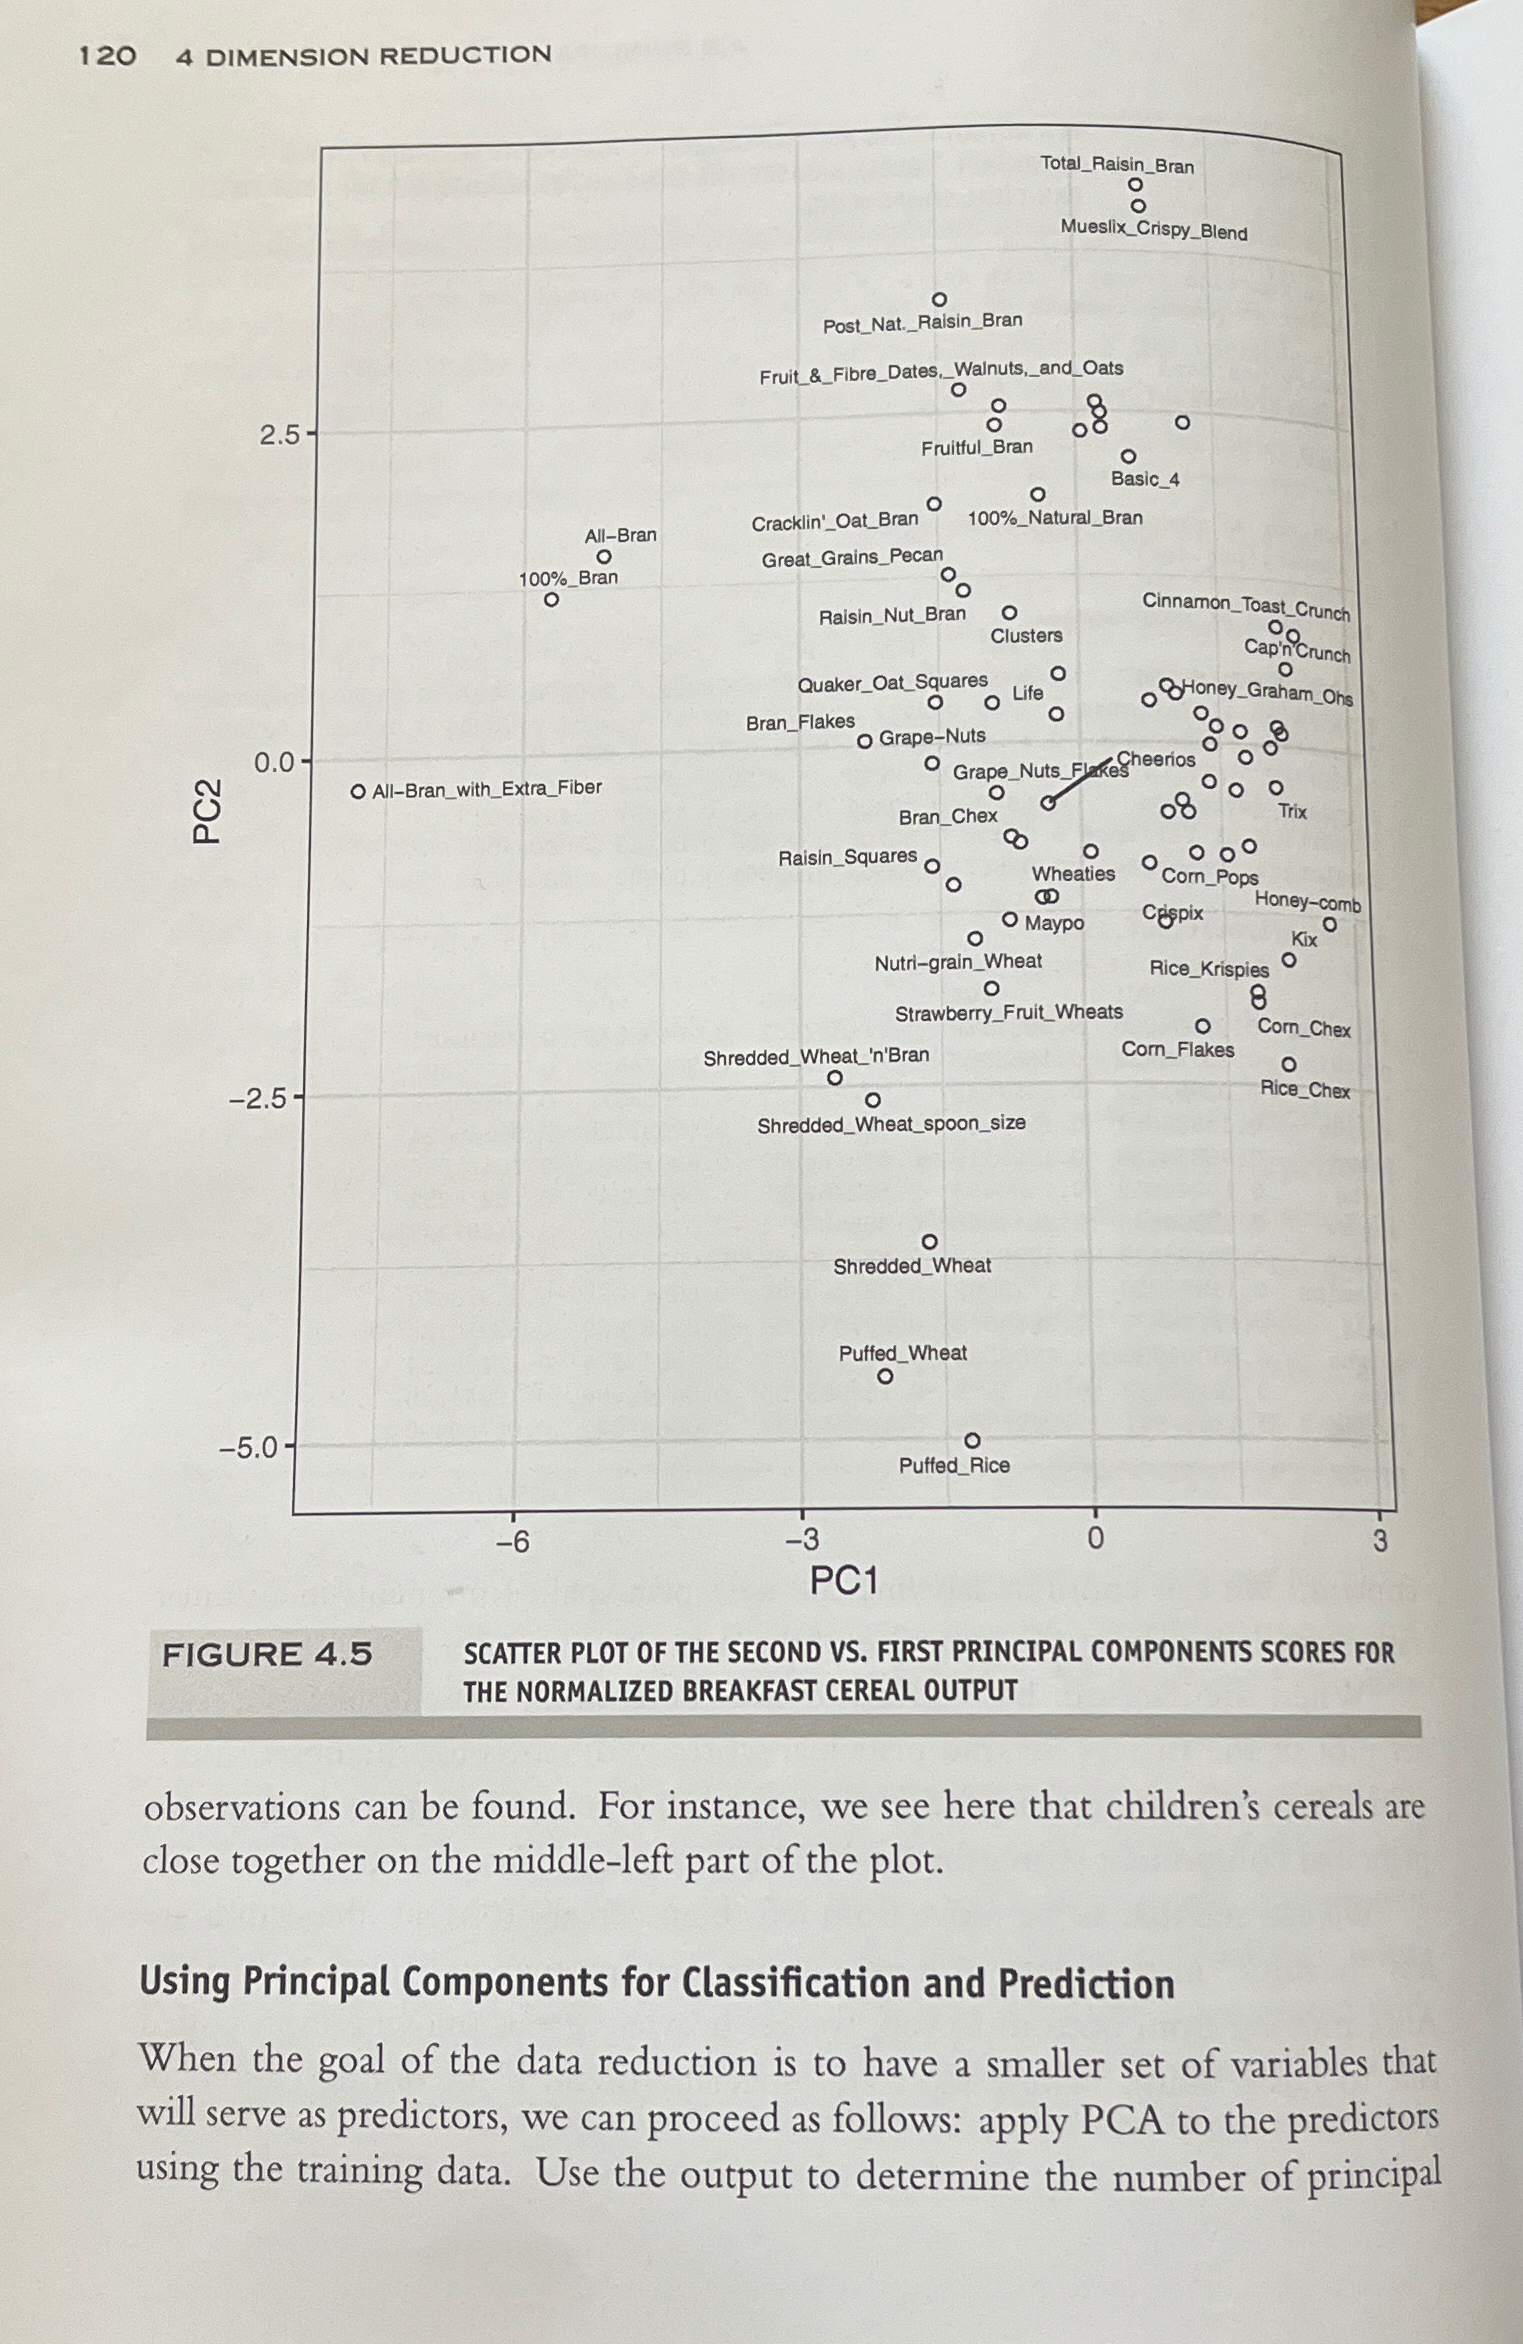
SCATTER PLOT OF THE SECOND VS FIRST PRINCIPAL COMPONENTS SCORES FOR THE NORMALIZED BREAKFAST CEREAL OUTPUT
observations can be found. For instance, we see here that children's cereals are close together on the middleleft part of the plot.
Using Principal Components for Classification and Prediction
When the goal of the data reduction is to have a smaller set of variables that will serve as predictors, we can proceed as follows: apply PCA to the predictors using the training data. Use the output to determine the number of principal.
Which variables are quantitive numerical? Which are ordinal? Which are nomial?
Step by Step Solution
There are 3 Steps involved in it
1 Expert Approved Answer
Step: 1 Unlock

Question Has Been Solved by an Expert!
Get step-by-step solutions from verified subject matter experts
Step: 2 Unlock
Step: 3 Unlock