

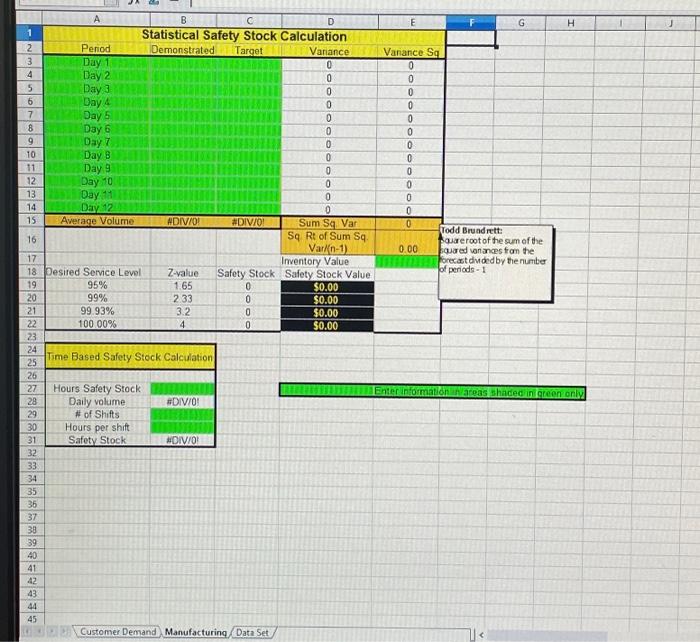
Question: 1 2 3 4 5 6 7 8 9 10 11 12 13 14 15 16 A Period Day 1 Day 2 Day 3 Day
1 2 3 4 5 6 7 8 9 10 11 12 13 14 15 16 A Period Day 1 Day 2 Day 3 Day 4 Day 5 Day 6 Day 7 Day 8 Day 9 Day 10 Day 11 Day 12 Average Volume 17 18 Desired Service Level 19 95% 20 99% 21 99.93% 22 100.00% 23 24 25 26 27 28 29 30 31 32 33 34 35 36 37 38 39 40 41 42 43 44 45 Hours Safety Stock Daily volume # of Shifts B C Statistical Safety Stock Calculation Demonstrated Target Hours per shift Safety Stock #DIV/0! Time Based Safety Stock Calculation Z-value 1.65 2.33 3.2 4 #DIV/0! #DIV/0! #DIV/0! Safety Stock 0 000 Customer Demand Manufacturing Data Set D Variance 0 OOOO 0 0 0 10 0 0 0 0 0 10 0 Sum Sq. Var Sq. Rt of Sum Sq. Var/(n-1) Inventory Value Safety Stock Value $0.00 $0.00 $0.00 $0.00 E Variance Sq 0 0 0 0 0 0 0 OOO 0 0 0 0 0 0 0.00 G Todd Brundrett: Square root of the sum of the squared variances from the forecast divided by the number of periods - 1 H Enter information in areas shaded in green only IL J
Step by Step Solution
There are 3 Steps involved in it
1 Expert Approved Answer
Step: 1 Unlock

Question Has Been Solved by an Expert!
Get step-by-step solutions from verified subject matter experts
Step: 2 Unlock
Step: 3 Unlock