

Question: 1. 2. 3. 4. 5. 6. 7. 8. 9. 10. Thank you so much!! Boxes of Honey-Nut Oatmeal are produced to contain 16.0 ounces, with
1.

2.

3.
4.
5.
6.
7.
8.
9.
10.
Thank you so much!!
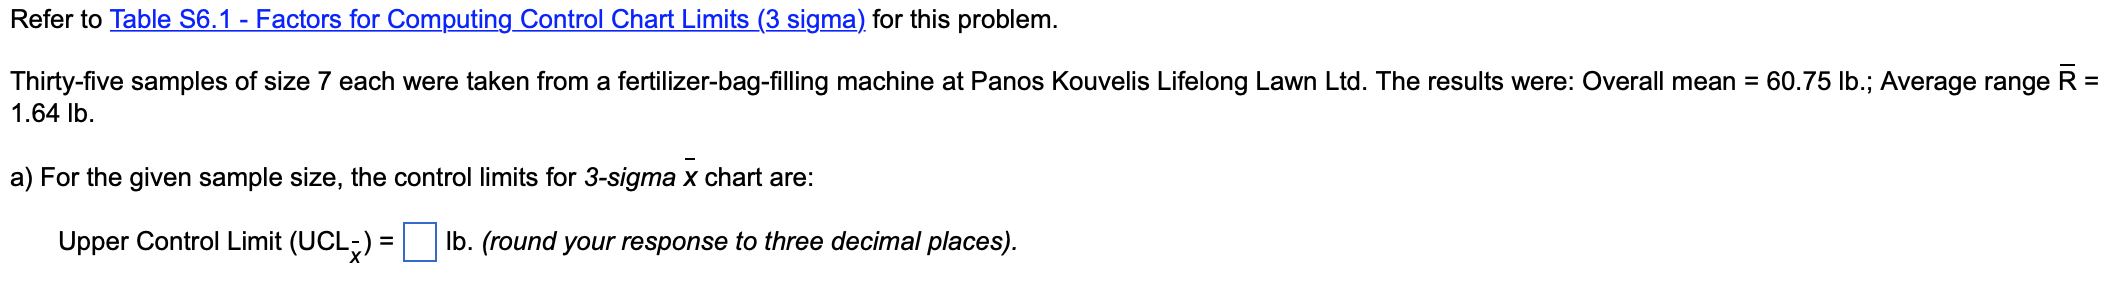
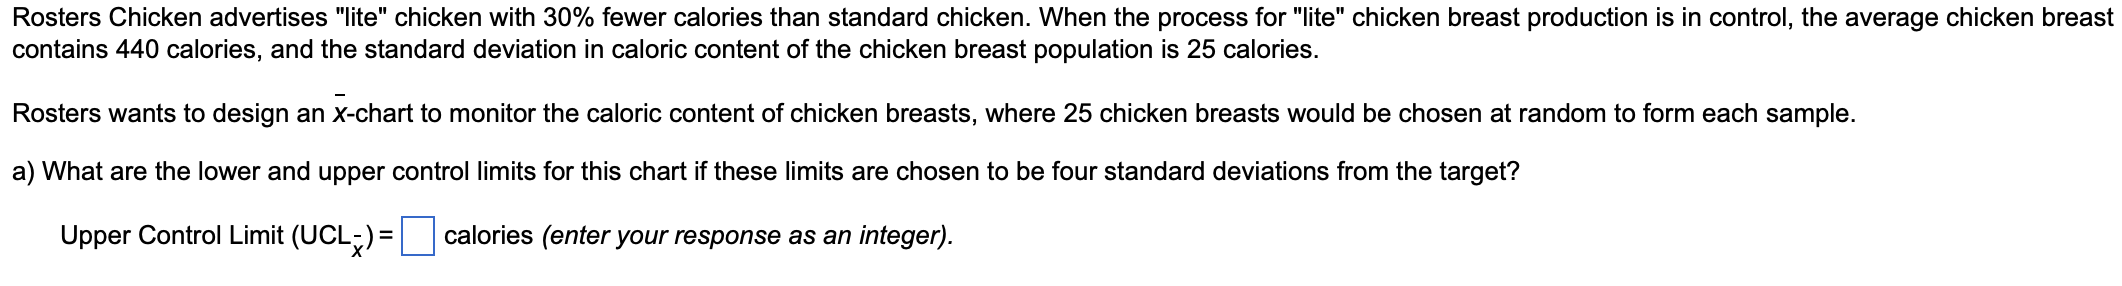
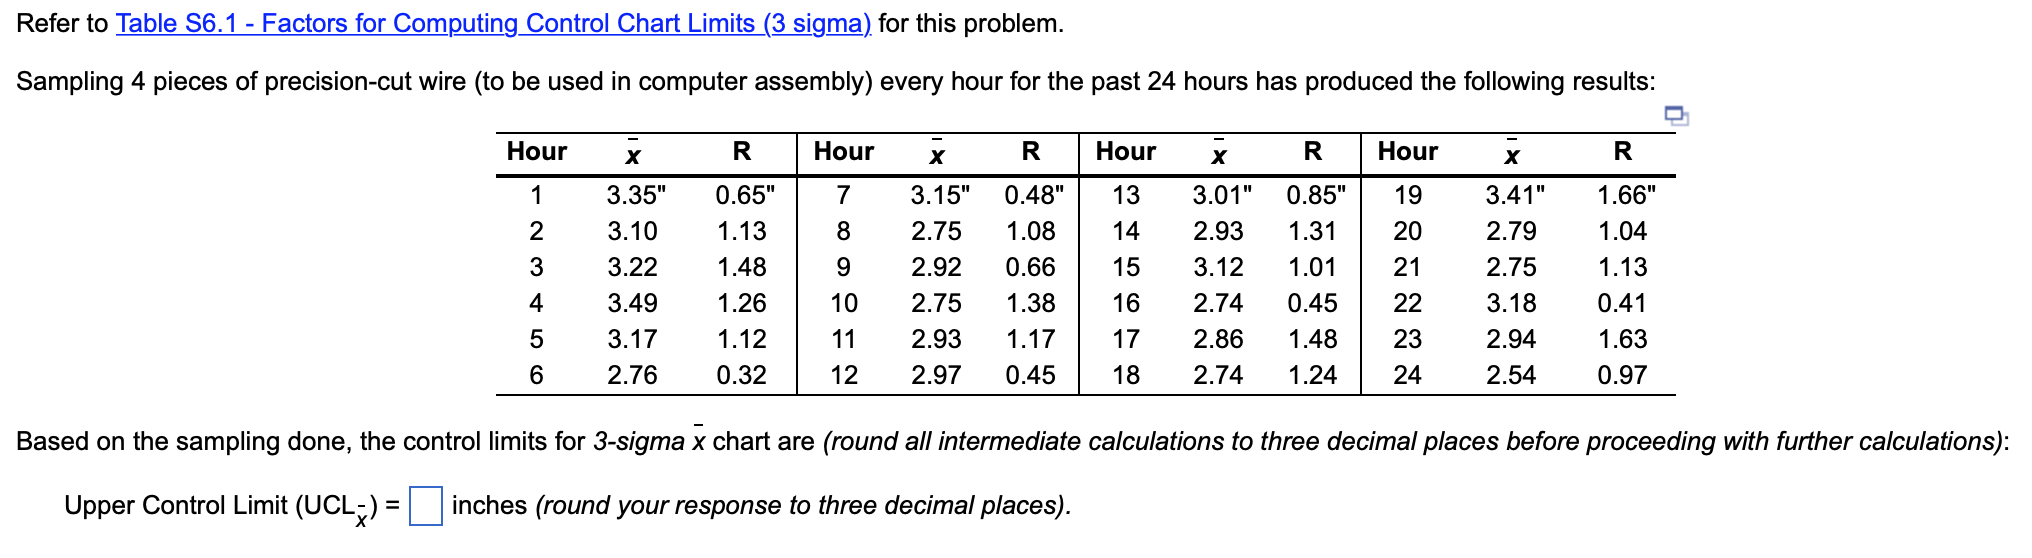
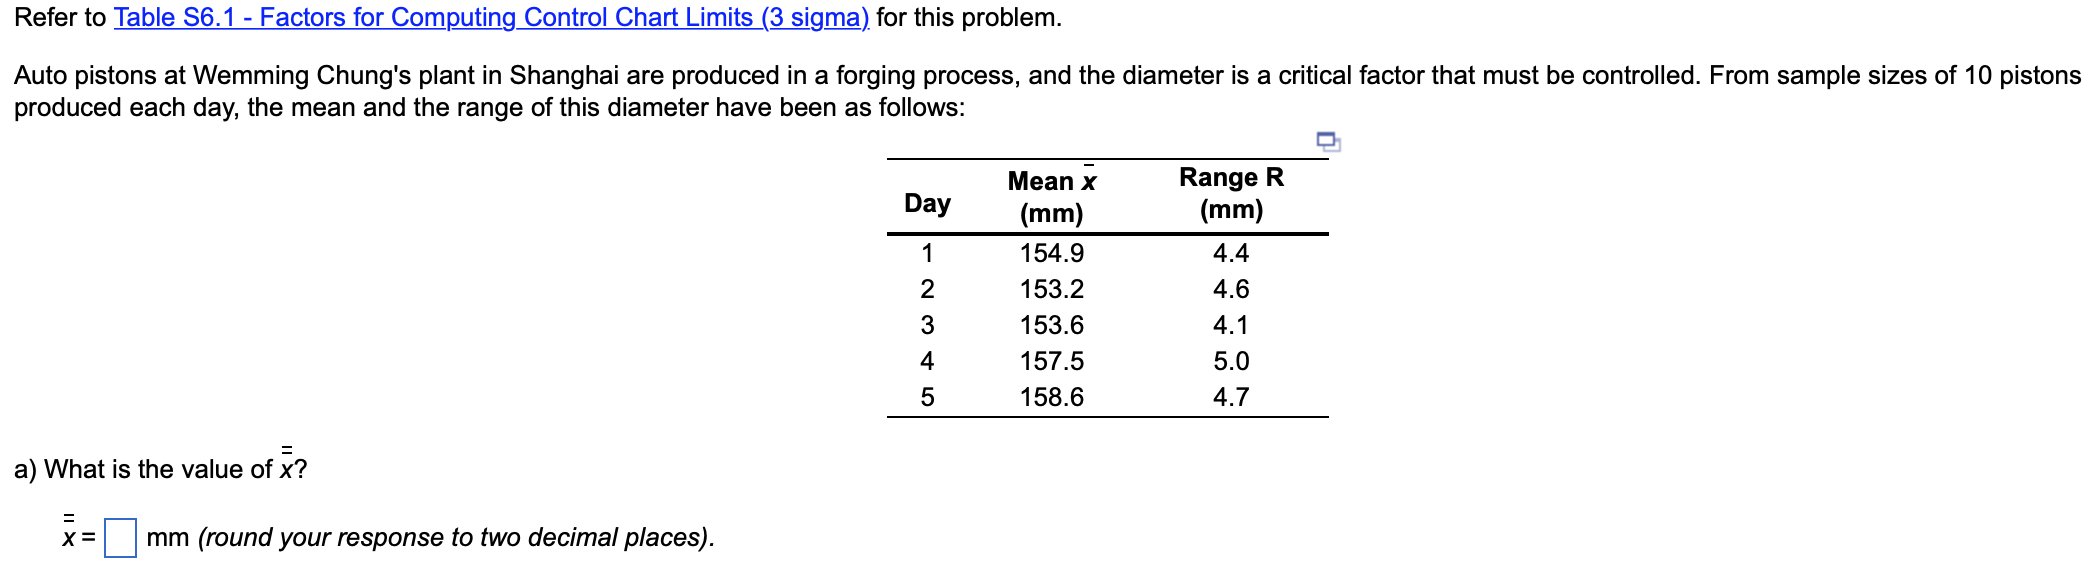
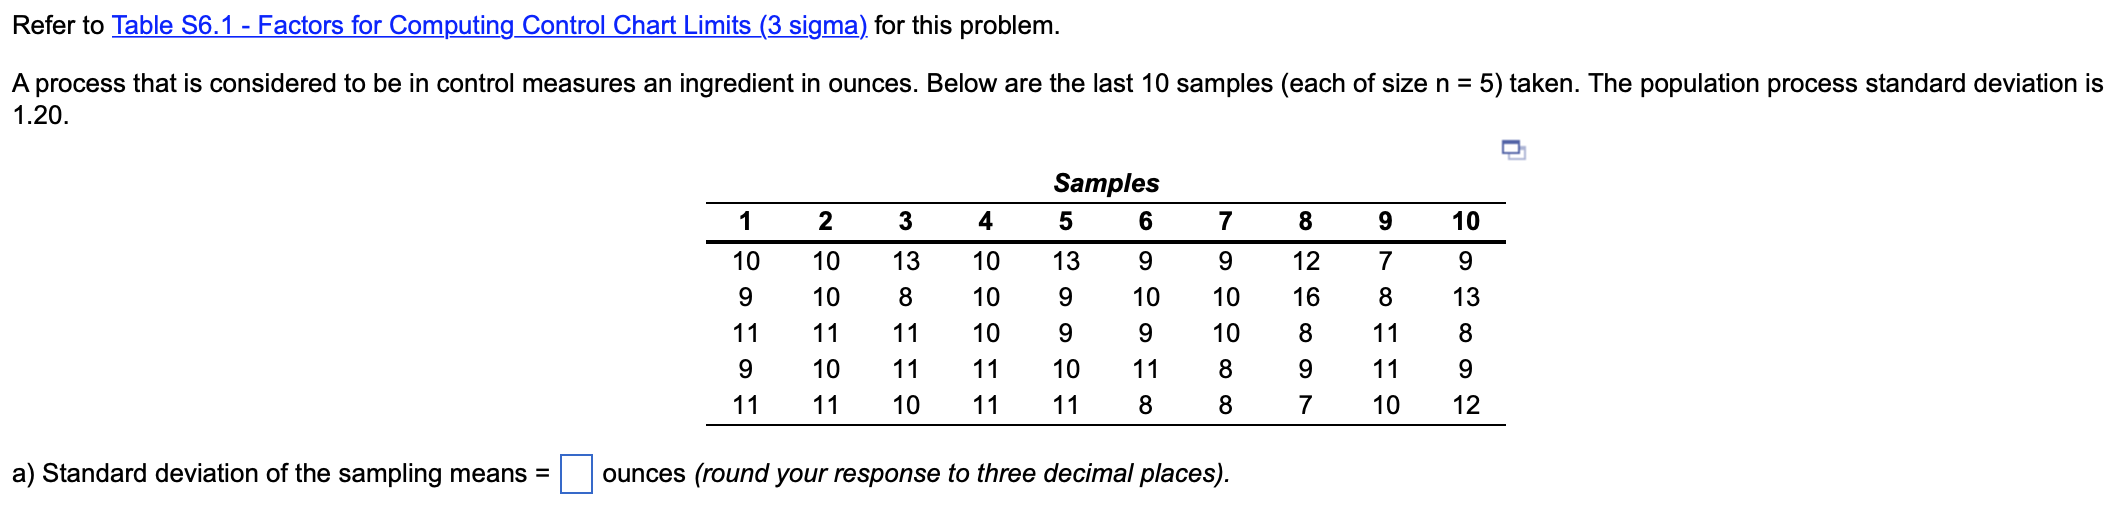
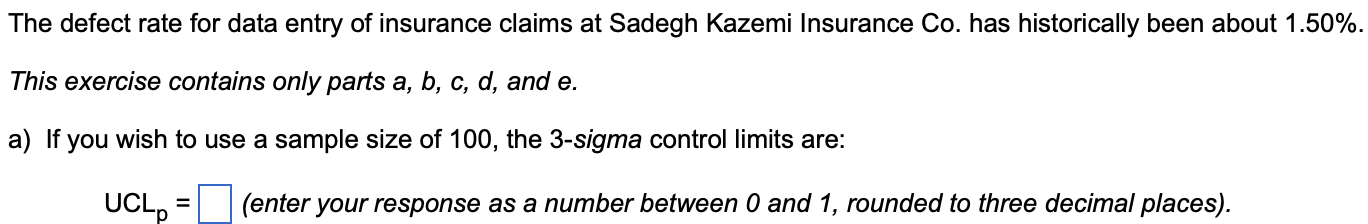
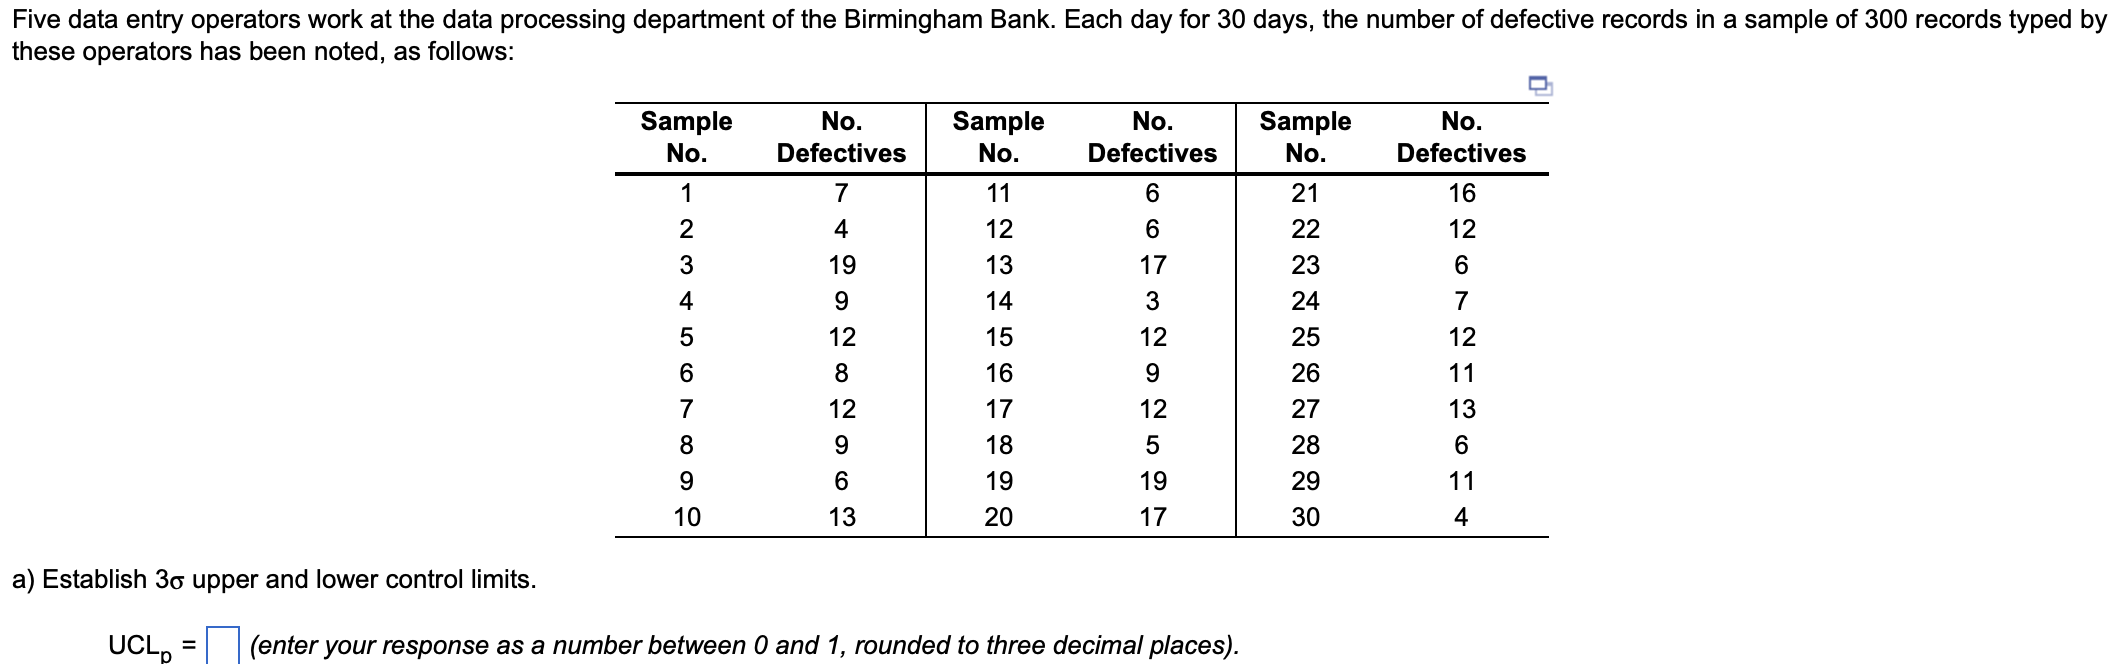
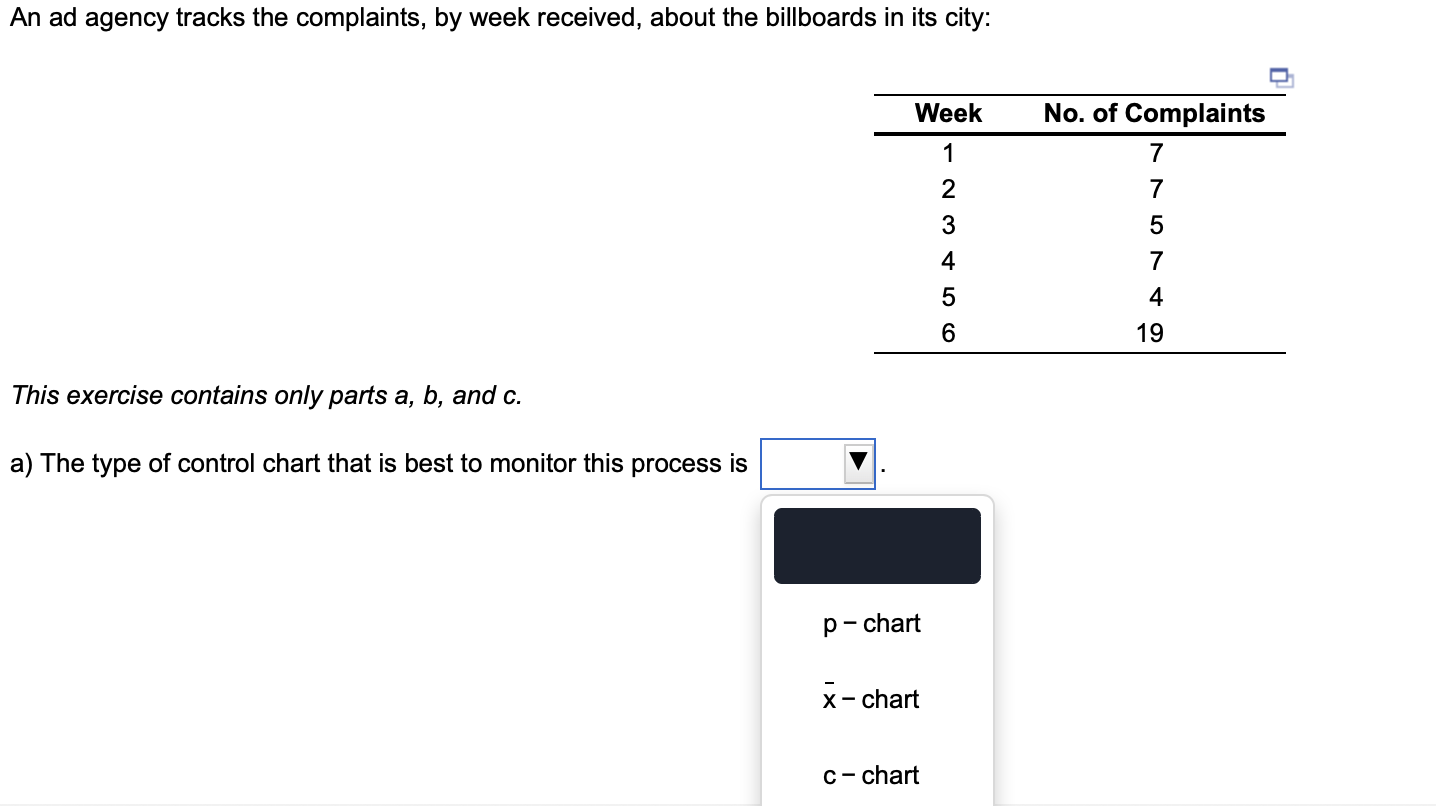
Boxes of Honey-Nut Oatmeal are produced to contain 16.0 ounces, with a standard deviation of 0.10 ounce. For a sample size of 36, the 3-sigma x chart control limits are: Upper Control Limit (UCL;) = | ounces (round your response to two decimal places). The overall average on a process you are attempting to monitor is 60.0 units. The process population standard deviation is 1.84. Sample size is given to be 4. a) Determine the 3-sigma x-chart control limits. Upper Control Limit (UCL;) = units (round your response to two decimal places). Refer to Table S6.1 - Factors for Computing Control Chart Limits (3 sigma) for this problem. Thirty-five samples of size 7 each were taken from a fertilizer-bag-filling machine at Panos Kouvelis Lifelong Lawn Ltd. The results were: Overall mean = 60.75 lb.; Average range R = 1.64 lb. a) For the given sample size, the control limits for 3-sigma x chart are: Upper Control Limit (UCL ) = 16. (round your response to three decimal places). Rosters Chicken advertises "lite" chicken with 30% fewer calories than standard chicken. When the process for "lite" chicken breast production is in control, the average chicken breast contains 440 calories, and the standard deviation in caloric content of the chicken breast population is 25 calories. Rosters wants to design an x-chart to monitor the caloric content of chicken breasts, where 25 chicken breasts would be chosen at random to form each sample. a) What are the lower and upper control limits for this chart if these limits are chosen to be four standard deviations from the target? Upper Control Limit (UCLz)= calories (enter your response as an integer). Refer to Table 56.1 - Factors for Computing Control Chart Limits (3 sigma) for this problem. Sampling 4 pieces of precision-cut wire (to be used in computer assembly) every hour for the past 24 hours has produced the following results: Hour R Hour R Hour R Hour R 1 7 13 14 2 8 3 9 3.35" 3.10 3.22 3.49 3.17 2.76 0.65" 1.13 1.48 1.26 1.12 0.32 3.15" 2.75 2.92 2.75 2.93 2.97 0.48" 1.08 0.66 1.38 1.17 0.45 15 16 3.01" 2.93 3.12 2.74 2.86 2.74 0.85" 1.31 1.01 0.45 1.48 1.24 19 20 21 22 23 24 3.41" 2.79 2.75 3.18 2.94 2.54 1.66" 1.04 1.13 0.41 1.63 0.97 4 5 10 11 12 17 18 6 Based on the sampling done, the control limits for 3-sigma x chart are (round all intermediate calculations to three decimal places before proceeding with further calculations): Upper Control Limit (UCL;) = inches (round your response to three decimal places). = Refer to Table 56.1 - Factors for Computing Control Chart Limits (3 sigma) for this problem. Auto pistons at Wemming Chung's plant in Shanghai are produced in a forging process, and the diameter is a critical factor that must be controlled. From sample sizes of 10 pistons produced each day, the mean and the range of this diameter have been as follows: Day 1 2 Mean x (mm) 154.9 153.2 153.6 157.5 158.6 Range R (mm) 4.4 4.6 4.1 5.0 4.7 3 4 5 a) What is the value : oft? X= mm (round your response two decimal places). Refer to Table 56.1 - Factors for Computing Control Chart Limits (3 sigma) for this problem. = A process that is considered to be in control measures an ingredient in ounces. Below are the last 10 samples (each of size n = 5) taken. The population process standard deviation is 1.20. Samples 5 6 1 2 3 4 7 8 9 10 10 12 9 10 9 13 9 9 10 9 10 16 13 11 10 10 11 10 11 13 8 11 11 10 10 10 11 9 9 10 8 7 8 11 11 10 8 11 8 9 9 9 11 10 11 11 8 8 7 12 a) Standard deviation of the sampling means = ounces (round your response to three decimal places). The defect rate for data entry of insurance claims at Sadegh Kazemi Insurance Co. has historically been about 1.50%. This exercise contains only parts a, b, c, d, and e. a) If you wish to use a sample size of 100, the 3-sigma control limits are: UCLP = (enter your response as a number between 0 and 1, rounded to three decimal places). Five data entry operators work at the data processing department of the Birmingham Bank. Each day for 30 days, the number of defective records in a sample of 300 records typed by these operators has been noted, as follows: Sample No. 1 No. Defectives Sample No. No. Defectives 6 2 000 WN No. Defectives 7 4 19 9 12 8 12 Sample No. 11 12 13 14 15 3 4 5 17 12 21 22 23 24 25 26 27 28 29 30 16 12 6 7 12 11 13 6 7 6Q3 29 259 16 17 18 12 8 9 6 6 11 9 10 19 20 19 17 13 4 a) Establish 30 upper and lower control limits. UCL = (enter your response as a number between 0 and 1, rounded to three decimal places). An ad agency tracks the complaints, by week received, about the billboards in its city: Week No. of Complaints 7 1 A 2 3 7 5 7 4 5 4 19 6 This exercise contains only parts a, b, and c. a) The type contro that is to monito his process is p-chart = x-chart C-chartStep by Step Solution
There are 3 Steps involved in it
1 Expert Approved Answer
Step: 1 Unlock

Question Has Been Solved by an Expert!
Get step-by-step solutions from verified subject matter experts
Step: 2 Unlock
Step: 3 Unlock