

Question: 1) 2) 3) 4) 5) 6) Question 15 4 points Save Answer The dean of a college is interested in the proportion of graduates from
1) 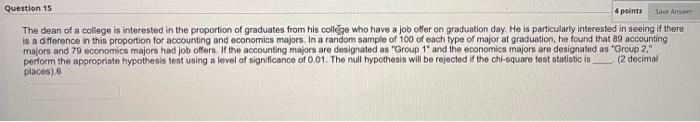
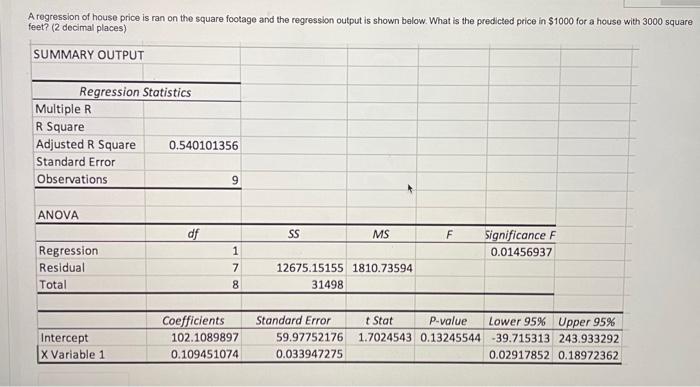
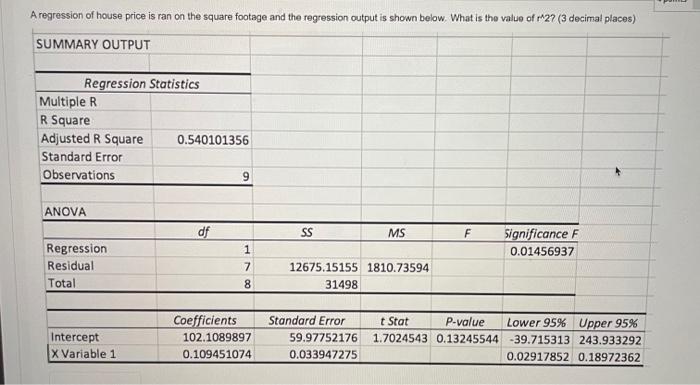
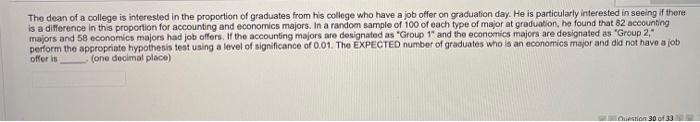
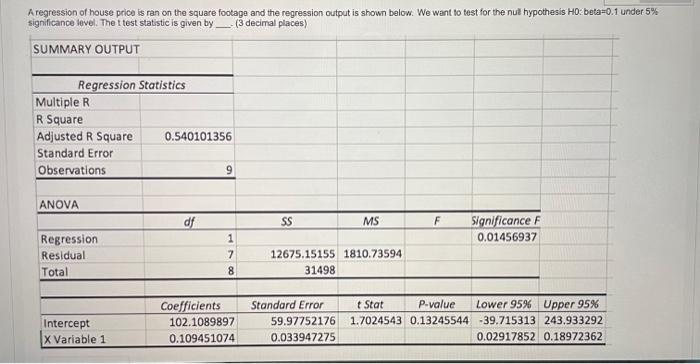
Question 15 4 points Save Answer The dean of a college is interested in the proportion of graduates from his college who have a job offer on graduation day. He is particularly interested in seeing if there is a difference in this proportion for accounting and economics majors. In a random sample of 100 of each type of major at graduation, he found that 89 accounting majors and 79 economics majors had job offers. If the accounting majors are designated as "Group 1" and the economics majors are designated as "Group 2," perform the appropriate hypothesis test using a level of significance of 0.01. The null hypothesis will be rejected if the chi-square tost statistic is (2 decimal places).6 A regression of house price is ran on the square footage and the regression output is shown below. What is the predicted price in $1000 for a house with 3000 square feet? (2 decimal places) SUMMARY OUTPUT Regression Statistics Multiple R R Square Adjusted R Square 0.540101356 Standard Error Observations 9 ANOVA df SS MS F Significance F 0.01456937 Regression Residual Total 1 7 12675.15155 1810.73594 31498 8 Intercept X Variable 1 Coefficients 102.1089897 0.109451074 Standard Error 59.97752176 0.033947275 Stat P-value Lower 95% Upper 95% 1.7024543 0.13245544 -39.715313 243.933292 0.02917852 0.18972362 A major department store chain in Maxatawny is interested in estimating the mean amount its credit card customers spent on their first visit to the chain's new storen the mall, 20 credit card accounts were randomly sampled and analyzed with the following results: sample mean=24 and sample standard deviation=13. The upper bound of the 80% confidence interval for the mean is (3 decimal places) A regression of house price is ran on the square footage and the regression output is shown below. What is the value of 27 (3 decimal places) SUMMARY OUTPUT Regression Statistics Multiple R R Square Adjusted R Square 0.540101356 Standard Error Observations 9 ANOVA df SS MS F Significance F 0.01456937 Regression Residual Total 1 7 8 12675.15155 1810.73594 31498 Intercept X Variable 1 Coefficients 102.1089897 0.109451074 Standard Error 59.97752176 0.033947275 t Stat P-value Lower 95% Upper 95% 1.7024543 0.13245544 -39.715313 243.933292 0.02917852 0.18972362 The dean of a college is interested in the proportion of graduates from his college who have a job offer on graduation day. He is particularly interested in seeing if there is a difference in this proportion for accounting and economics majors. In a random sample of 100 of each type of major at graduation, he found that 82 accounting majors and 58 economics majors had job offers. If the accounting majors are designated as "Group 1" and the economics majors are designated as "Group 2," perform the appropriate hypothesis test using a level of significance of 0.01 The EXPECTED number of graduates who is an economics major and did not have a job offer is (one decimal place) Gestion 30 of 33 A regression of house price is ran on the square footage and the regression output is shown below. We want to test for the nul hypothesis Ho: beta=0.1 under 5% significance level. The i test statistic is given by (3 decimal places) SUMMARY OUTPUT Regression Statistics Multiple R R Square Adjusted R Square 0.540101356 Standard Error Observations 9 ANOVA df SS MS F Significance F 0.01456937 Regression Residual Total 1 7 8 12675.15155 1810.73594 31498 Intercept X Variable 1 Coefficients 102.1089897 0.109451074 Standard Error 59.97752176 0.033947275 t Stat P-value Lower 95% Upper 95% 1.7024543 0.13245544 -39.715313 243.933292 0.02917852 0.18972362
2)
3)
4)
5)
6)
Step by Step Solution
There are 3 Steps involved in it
1 Expert Approved Answer
Step: 1 Unlock

Question Has Been Solved by an Expert!
Get step-by-step solutions from verified subject matter experts
Step: 2 Unlock
Step: 3 Unlock