

Question: 1. 2. 3. A E 1 2 3 4 B D Productive Capacity 50,000 units Fixed Budget For the year ended December 31, 2020 Per
1.

 2.
2.
 3.
3.
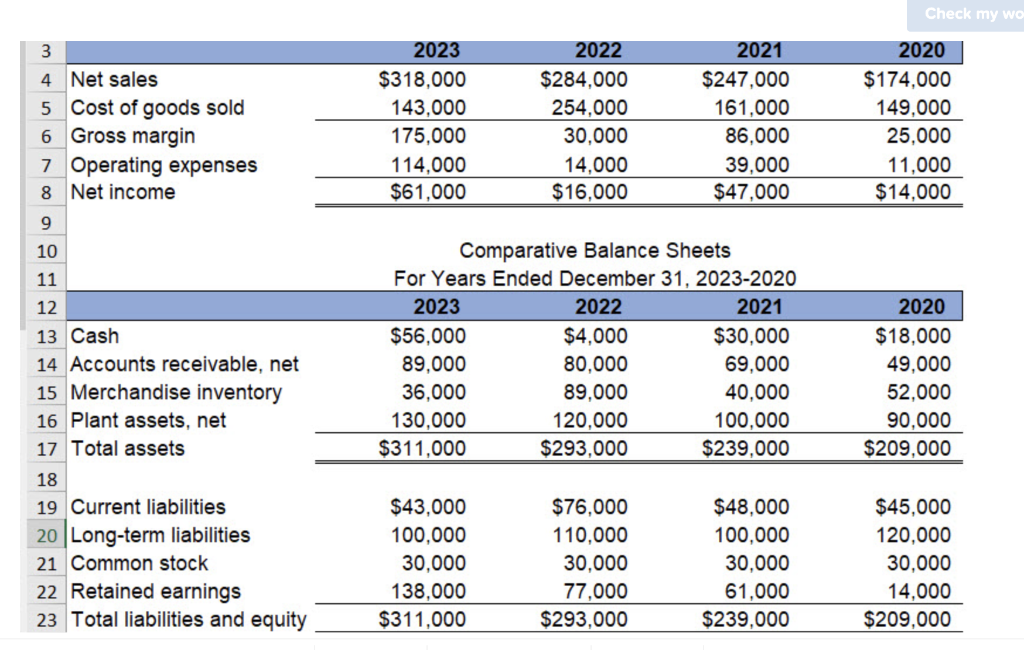
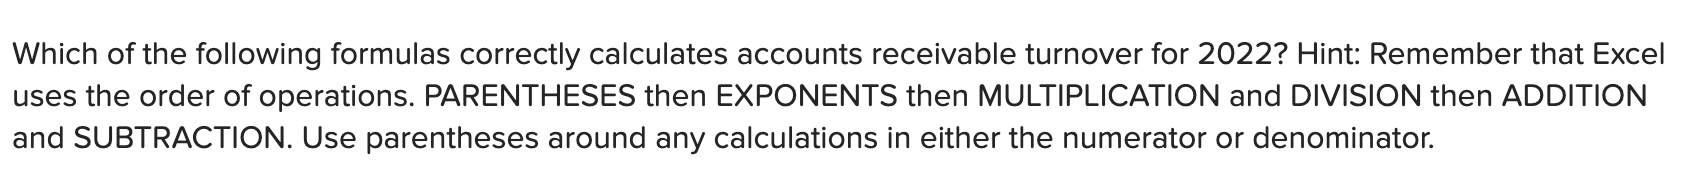
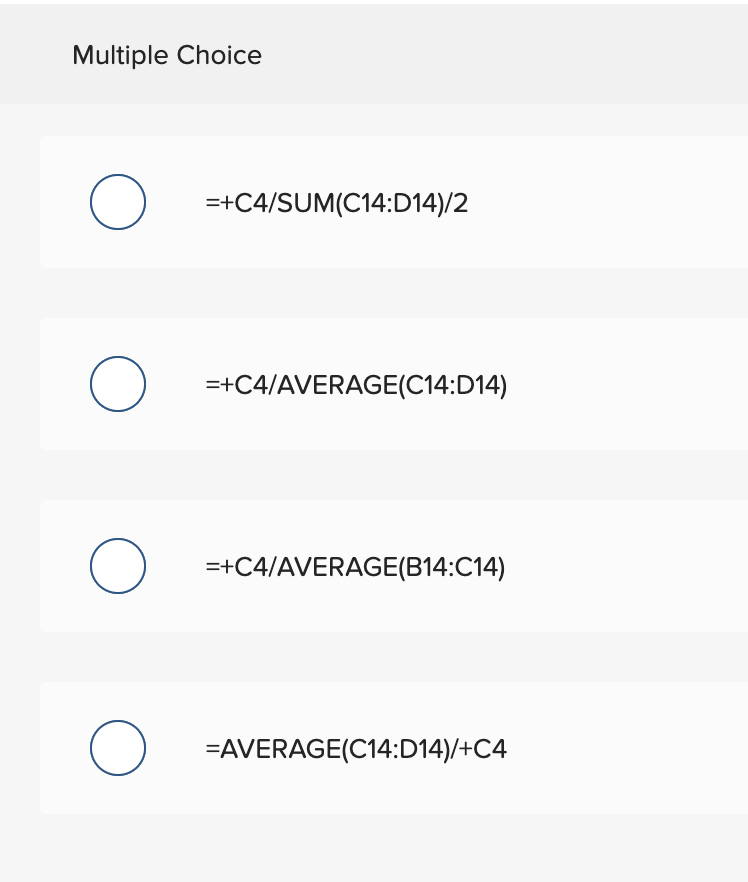
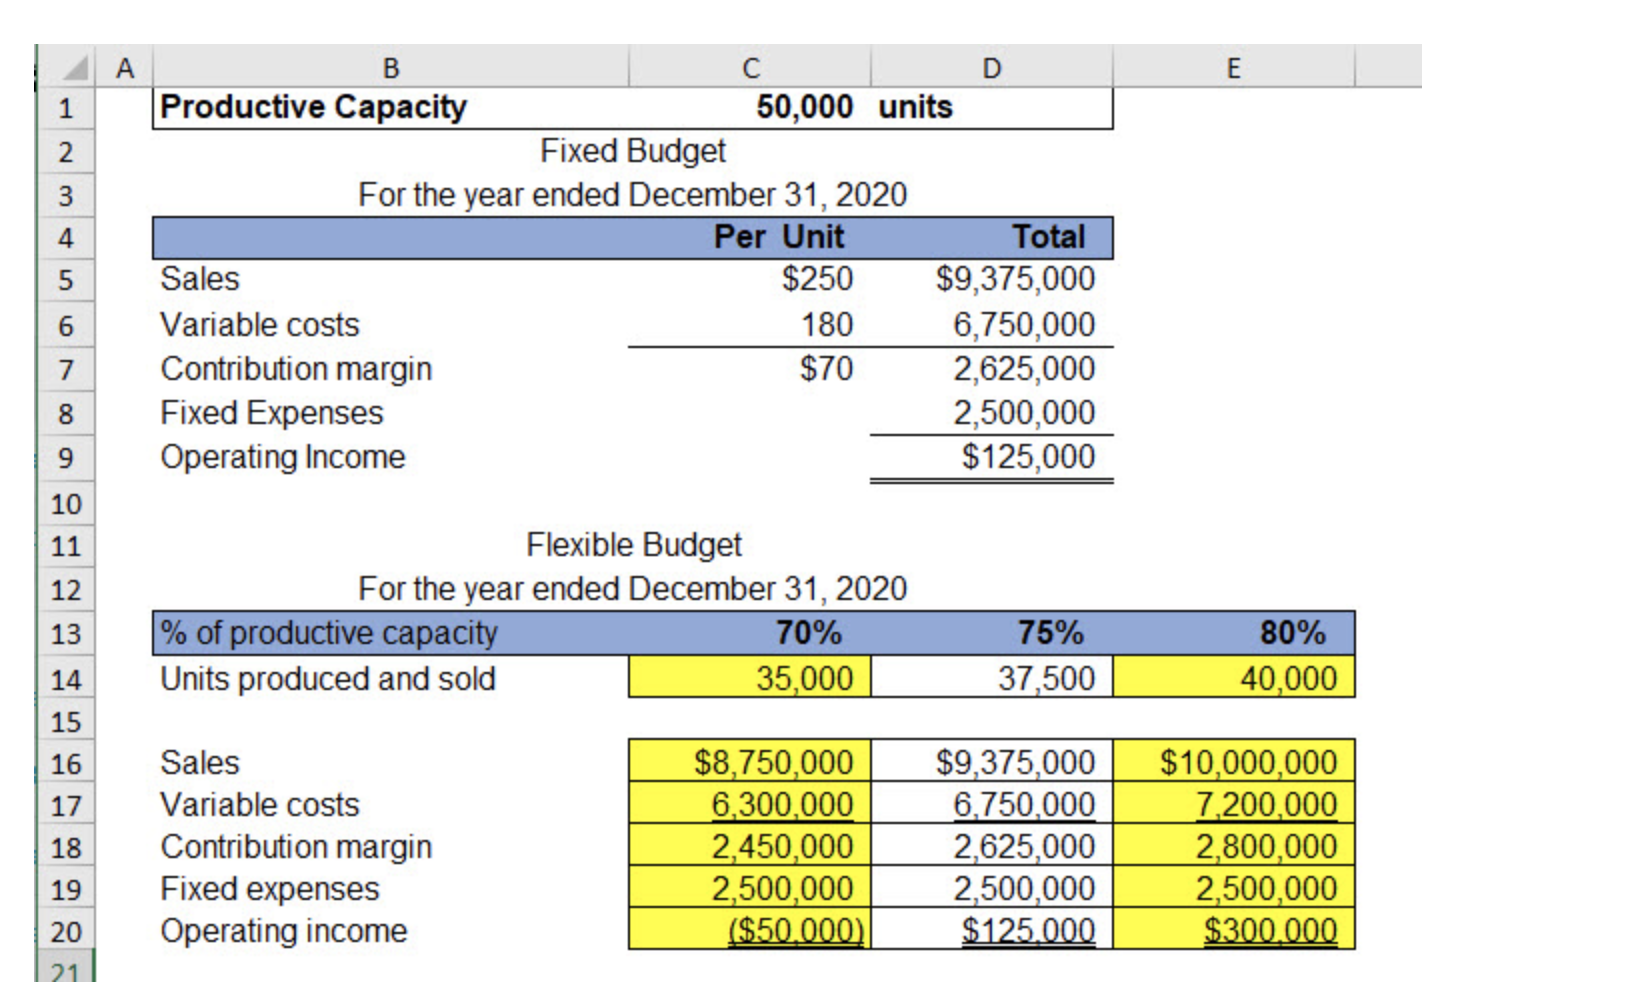
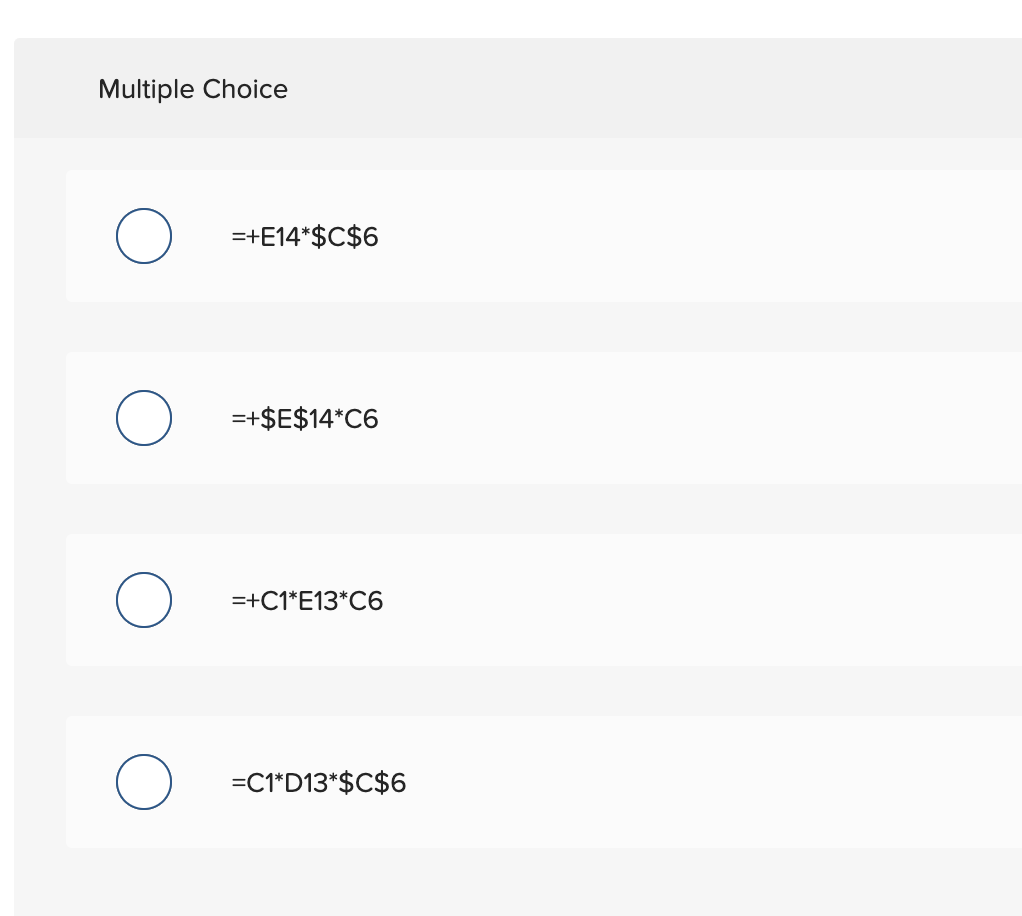
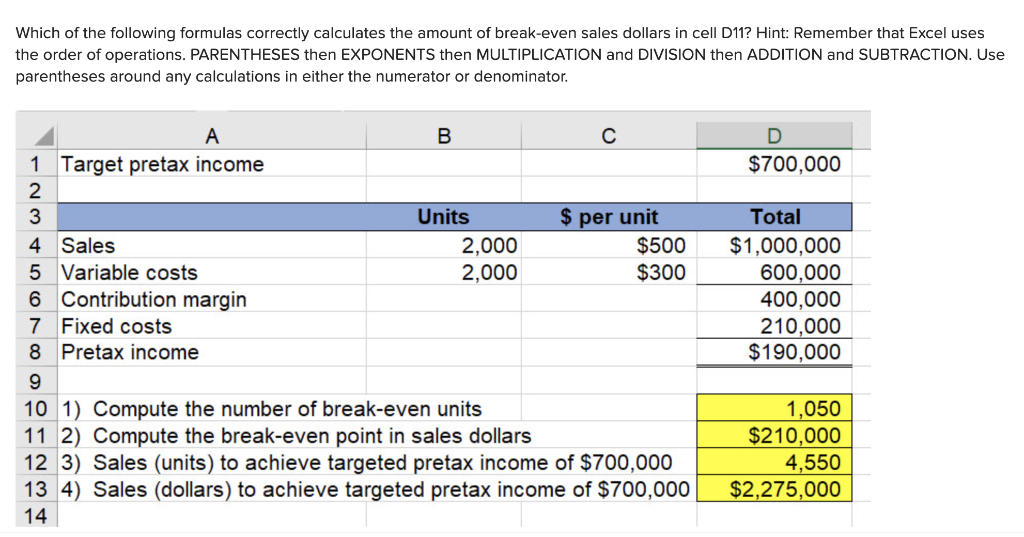
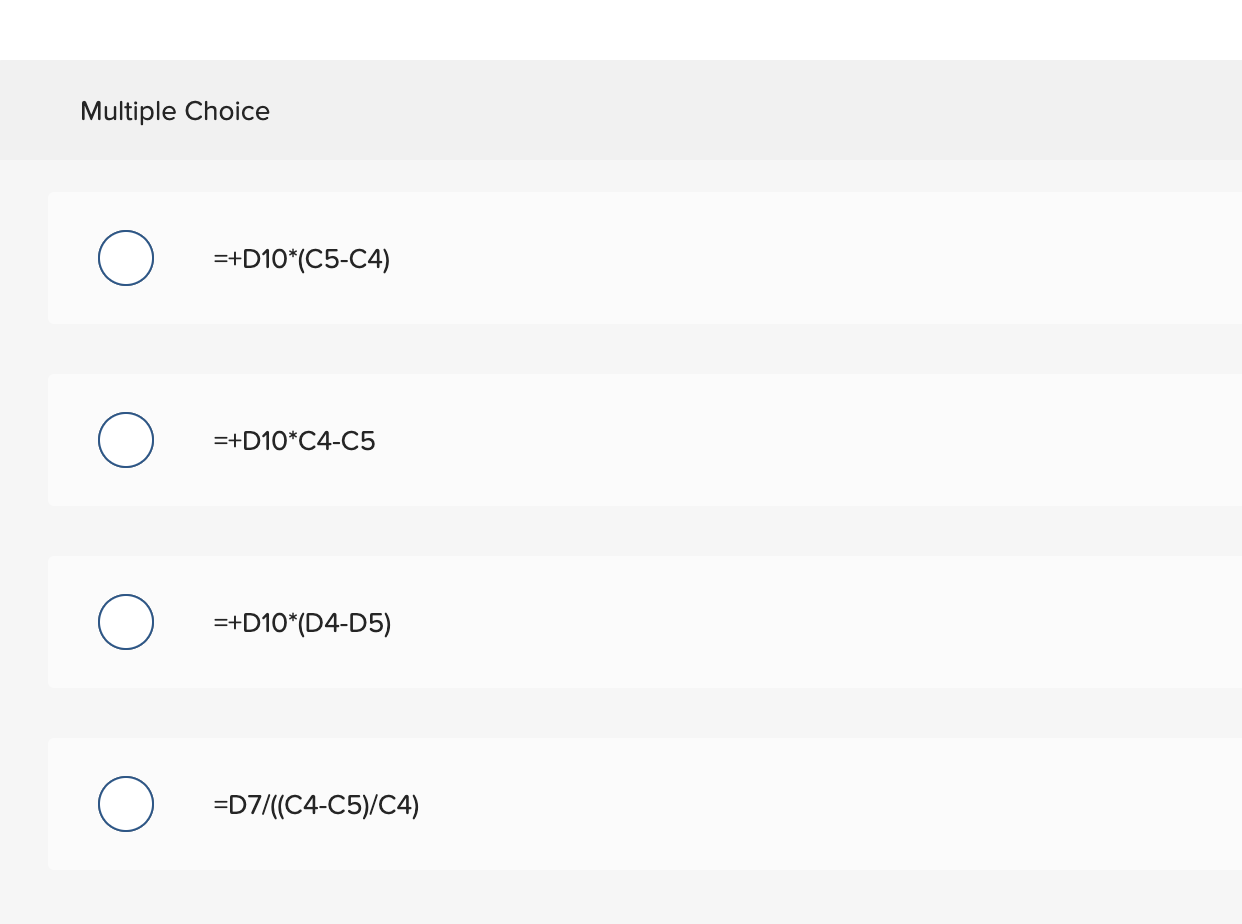
A E 1 2 3 4 B D Productive Capacity 50,000 units Fixed Budget For the year ended December 31, 2020 Per Unit Total Sales $250 $9,375,000 Variable costs 180 6,750,000 Contribution margin $70 2,625,000 Fixed Expenses 2,500,000 Operating Income $125,000 5 6 7 8 9 10 11 12 13 Flexible Budget For the year ended December 31, 2020 % of productive capacity 70% Units produced and sold 35,000 75% 37,500 80% 40,000 14 15 16 17 18 19 20 21 Sales Variable costs Contribution margin Fixed expenses Operating income $8,750,000 6,300,000 2,450,000 2,500,000 ($50.000) $9,375,000 6,750,000 2,625,000 2,500,000 $125.000 $10,000,000 7,200,000 2,800,000 2,500,000 $300.000 Applying Excel 13: Variable costs Which of the following formulas does NOT yield the correct answer in cell E17? Multiple Choice =+E14*$C$6 =+$E$14*C6 =+C1*E13*C6 =C1*D13*$C$6 Which of the following formulas correctly calculates the amount of break-even sales dollars in cell D11? Hint: Remember that Excel uses the order of operations. PARENTHESES then EXPONENTS then MULTIPLICATION and DIVISION then ADDITION and SUBTRACTION. Use parentheses around any calculations in either the numerator or denominator. D $700,000 A B 1 Target pretax income 2 3 Units $ per unit 4 Sales 2,000 $500 5 Variable costs 2,000 $300 6 Contribution margin 7 Fixed costs 8 Pretax income 9 10 1) Compute the number of break-even units 11 2) Compute the break-even point in sales dollars 3) Sales (units) to achieve targeted pretax income of $700,000 13 4) Sales (dollars) to achieve targeted pretax income of $700,000 Total $1,000,000 600,000 400,000 210,000 $190,000 1,050 $210,000 4,550 $2,275,000 14 Multiple Choice =+D10*(C5-C4) =+D10*C4-C5 =+D10*(D4-D5) =D7/((C4-C5)/C4) Check my wo 3 4 Net sales 5 Cost of goods sold 6 Gross margin 7 Operating expenses 8 Net income 2023 $318,000 143,000 175,000 114,000 $61,000 2022 $284,000 254,000 30,000 14.000 $16,000 2021 $247,000 161,000 86,000 39,000 $47,000 2020 $174,000 149,000 25,000 11,000 $14,000 9 10 11 Comparative Balance Sheets For Years Ended December 31, 2023-2020 2023 2022 2021 $56,000 $4,000 $30,000 89,000 80,000 69,000 36,000 89,000 40,000 130,000 120,000 100,000 $311,000 $293,000 $239,000 2020 $18,000 49,000 52,000 90,000 $209,000 12 13 Cash 14 Accounts receivable, net 15 Merchandise inventory 16 Plant assets, net 17 Total assets 18 19 Current liabilities 20 Long-term liabilities 21 Common stock 22 Retained earnings 23 Total liabilities and equity $43,000 100,000 30,000 138,000 $311,000 $76,000 110,000 30,000 77,000 $293.000 $48,000 100,000 30,000 61,000 $239,000 $45,000 120,000 30,000 14,000 $209,000 Which of the following formulas correctly calculates accounts receivable turnover for 2022? Hint: Remember that Excel uses the order of operations. PARENTHESES then EXPONENTS then MULTIPLICATION and DIVISION then ADDITION and SUBTRACTION. Use parentheses around any calculations in either the numerator or denominator. Multiple Choice () =+C4/SUM(C14:D14)/2 () =+C4/AVERAGE(C14:014) () =+C4/AVERAGE(B14:C14) () =AVERAGE(C14:D14)/+C4
Step by Step Solution
There are 3 Steps involved in it

Get step-by-step solutions from verified subject matter experts