

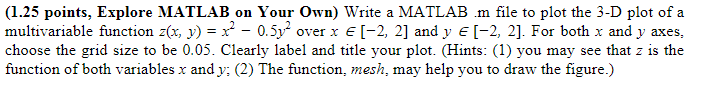
Question: ( 1 . 2 5 points, Explore MATLAB on Your Own ) Write a MATLAB m file to plot the 3 - D plot of
points, Explore MATLAB on Your Own Write a MATLAB file to plot the plot of a
multivariable function over xin and yin For both and axes,
choose the grid size to be Clearly label and title your plot. Hints: you may see that is the
function of both variables and ; The function, mesh, may help you to draw the figure.
Step by Step Solution
There are 3 Steps involved in it
1 Expert Approved Answer
Step: 1 Unlock

Question Has Been Solved by an Expert!
Get step-by-step solutions from verified subject matter experts
Step: 2 Unlock
Step: 3 Unlock