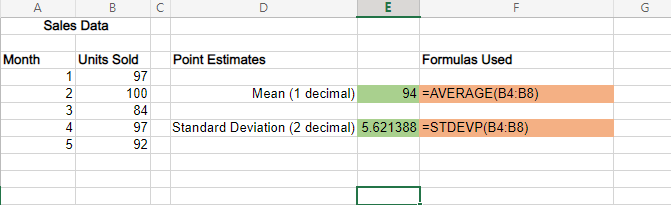
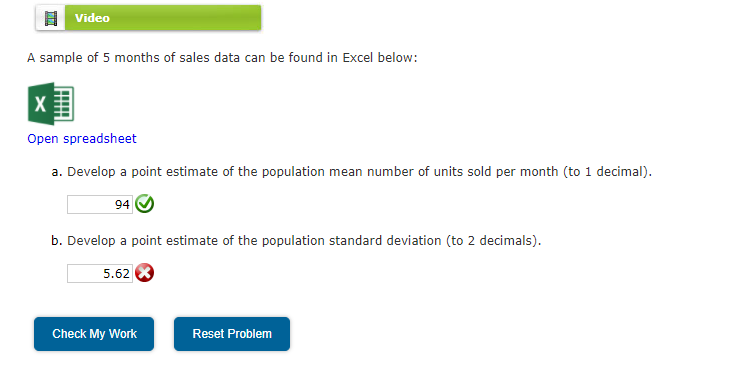
Question: 1. 2. E F G A B Sales Data Month Point Estimates Formulas Used Units Sold 1 97 2 100 3 84 4 97 92

1.1. 2. E F G A B Sales Data Month Point Estimates1. 2. E F G A B Sales Data Month Point Estimates

2.1. 2. E F G A B Sales Data Month Point Estimates1. 2. E F G A B Sales Data Month Point Estimates

E F G A B Sales Data Month Point Estimates Formulas Used Units Sold 1 97 2 100 3 84 4 97 92 Mean (1 decimal) 94 =AVERAGE(B4:38) Standard Deviation (2 decimal) 5.621388 ESTDEVP(B4:38) Video A sample of 5 months of sales data can be found in Excel below: Open spreadsheet a. Develop a point estimate of the population mean number of units sold per month (to 1 decimal). 94 b. Develop a point estimate of the population standard deviation (to 2 decimals). 5.62 Check My Work Reset Problem G2 E E F G H 1 Formula Used Sample Size #N/A Number of Stocks (Rating of 5 Stars) #N/A Point Estimate (Rating of 5 Stars) #N/A Number of Stocks (Low Business Risk) #N/A Point Estimate (Low Business Risk) #N/A Number of Stocks (Rating of 3 Stars or Less) #N/A Point Estimate (Rating of 3 Stars or Less) #N/A A 1 1 Company 2 2 Ameren Corp 3 Apple Inc 4 4 At&T Inc 5 5 Bank of New York Mellon Corp 6 BlackRock Inc 7 Buckeye Partners 8 Cardinal Health Inc 9 CenturyLink Inc Pintor 10 Cintas Corporation 11 Colgate-Palmolive Company 12 Corning Inc 13 Darden Restaurants Inc 14 Discover Financial Services 15 eBay Inc 16 Endo Health Solutions 17 Fair Isaaac Corp 18 Fluor Corp 19 Gentex Corporation 20 Group 1 Automotive Inc 21 Hess Corp 22 Icon PLC 23 International Flavors & Fragrances 24 John Wiley & Sons, Inc 25 Knight Transportation, Inc. 26 Life Technologies corp 27 Marvell Technology Group, Ltd. 28 Methanex Corporation 29 Mylan Inc 30 New York Times Company 31 OfficeMax Inc 32 Owens-Corning, Inc. 33 Polaris Industries, Inc. 34 Rio Tinto PLC 35 Sempra Energy 36 Stifel Financial Corp. 37 Texas Instruments, Inc. 38 United Technologies Corp 39 Weight Watchers International, Inc. 40 WR Berkley Corp 41 Yum Brands Inc 42 B D Morningstar Rating Business Risk 4 Star Average 5 Star High 2 Star High 4 Star Very Low 3 Star Average 4 Star Low 1 Star Very Low 1 Star Low 1 Star Average 1 1 Star Average 2 Star High 1 Star Very Low 3 Star Average 5 Star High 5 Star Very Low 2 Star very Very Low 5 Star Very Low 5 Star Average 3 Star High 4 Star High 3 Star High 5 Star 3 Star Very Low 5 Star Very Low 5 Star Very Low 3 Star Average 5 Star Average 3 Star Average 2 Star Very Low 5 Star Very Low 5 Star Low 3 Star Very Low 3 Star Very Low 5 Star Very Low 3 Star Low 4 Star Average 5 Star Very Low 4 Star High 5 Star Average 2 Star High Very Low 43 Video Morningstar publishes information on 1208 company stocks. A sample of 40 of these stocks is contained in the Excel Online file below. Construct a spreadsheet to answer the following questions. Open spreadsheet a. Develop a point estimate of the proportion of the stocks that receive Morningstar's highest rating of 5 stars. (to 2 decimals) b. Develop a point estimate of the proportion of the Morningstar stocks that are rated low with respect to business risk. (to 2 decimals) c. Develop a point estimate of the proportion of the Morningstar stocks that are rated 3 Stars or less. (to 2 decimals) Check My Work Reset

Step by Step Solution

There are 3 Steps involved in it

1 Expert Approved Answer
Step: 1 Unlock blur-text-image
Question Has Been Solved by an Expert!

Get step-by-step solutions from verified subject matter experts

Step: 2 Unlock
Step: 3 Unlock

Students Have Also Explored These Related General Management Questions!