

Question: 1 2 Numeric 2 points The graph of f ' ( x ) is shown in the figure below. By how much has the value
Numeric points
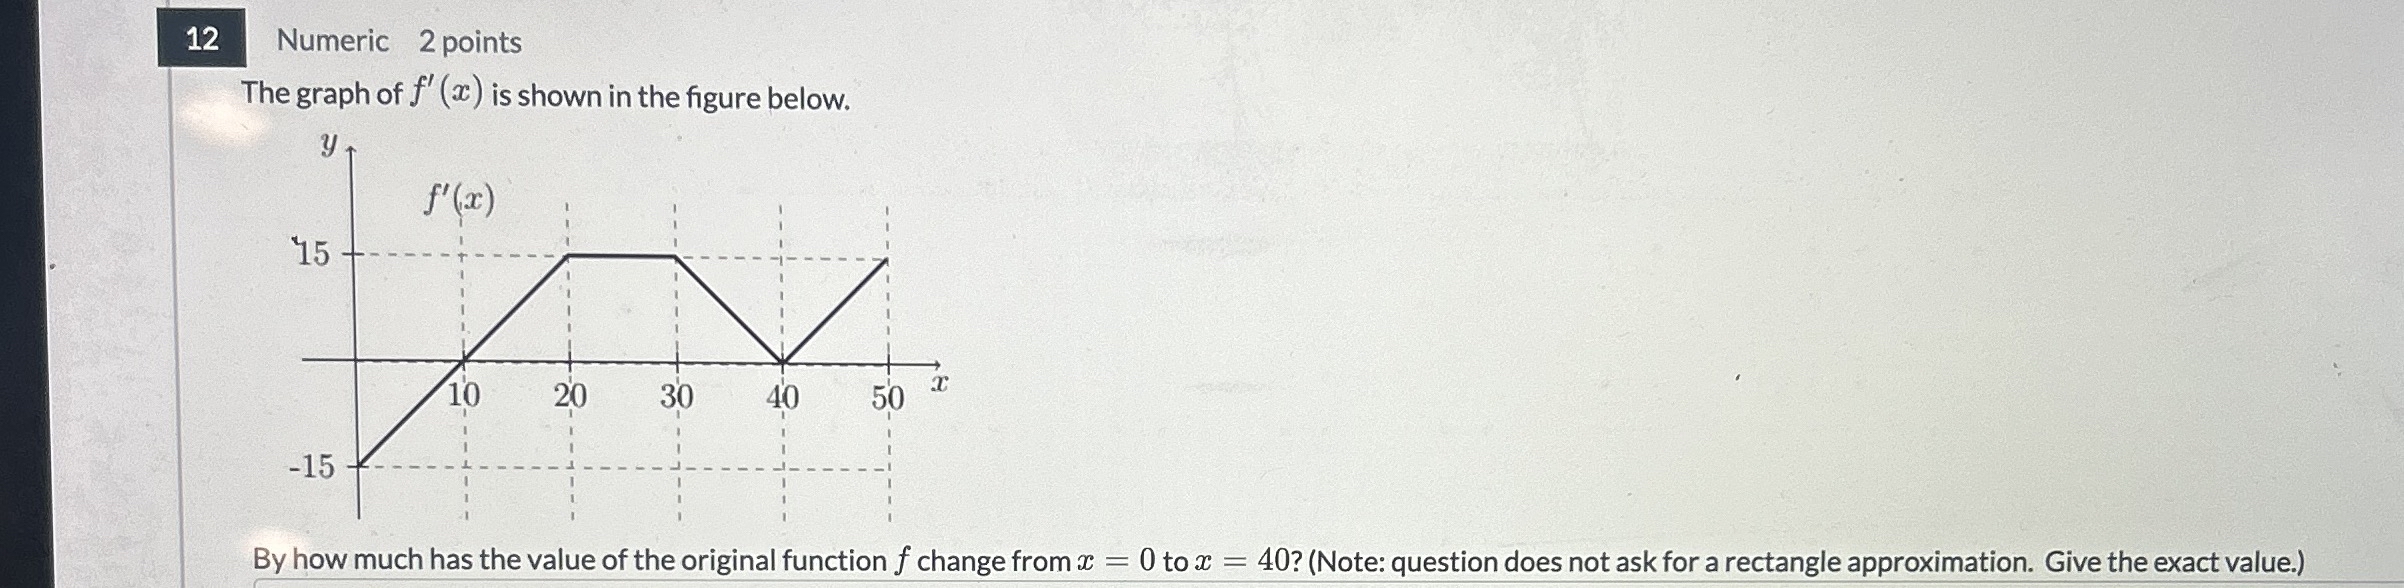
The graph of is shown in the figure below.
By how much has the value of the original function change from to Note: question does not ask for a rectangle approximation. Give the exact value.
Step by Step Solution
There are 3 Steps involved in it
1 Expert Approved Answer
Step: 1 Unlock

Question Has Been Solved by an Expert!
Get step-by-step solutions from verified subject matter experts
Step: 2 Unlock
Step: 3 Unlock