

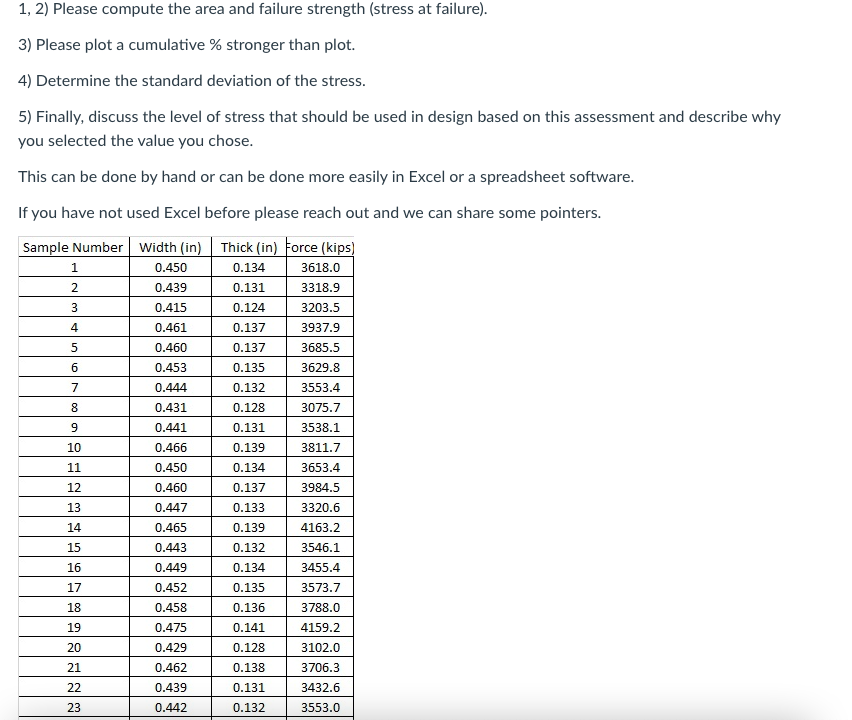
Question: 1 , 2 ) Please compute the area and failure strength ( stress at failure ) . Please plot a cumulative % stronger than plot.
Please compute the area and failure strength stress at failure
Please plot a cumulative stronger than plot.
Determine the standard deviation of the stress.
Finally, discuss the level of stress that should be used in design based on this assessment and describe why you selected the value you chose.
This can be done by hand or can be done more easily in Excel or a spreadsheet software.
If you have not used Excel before please reach out and we can share some pointers.
tableSample Number,Width inThick inForce kips
Step by Step Solution
There are 3 Steps involved in it
1 Expert Approved Answer
Step: 1 Unlock

Question Has Been Solved by an Expert!
Get step-by-step solutions from verified subject matter experts
Step: 2 Unlock
Step: 3 Unlock