

Question: 1. (2 points) Consider the data in Exhibit 1. What does it say about the competitive position of Nextel in the marketplace relative to its
1. (2 points) Consider the data in Exhibit 1. What does it say about the competitive position of Nextel in the marketplace relative to its competitors? Explain.
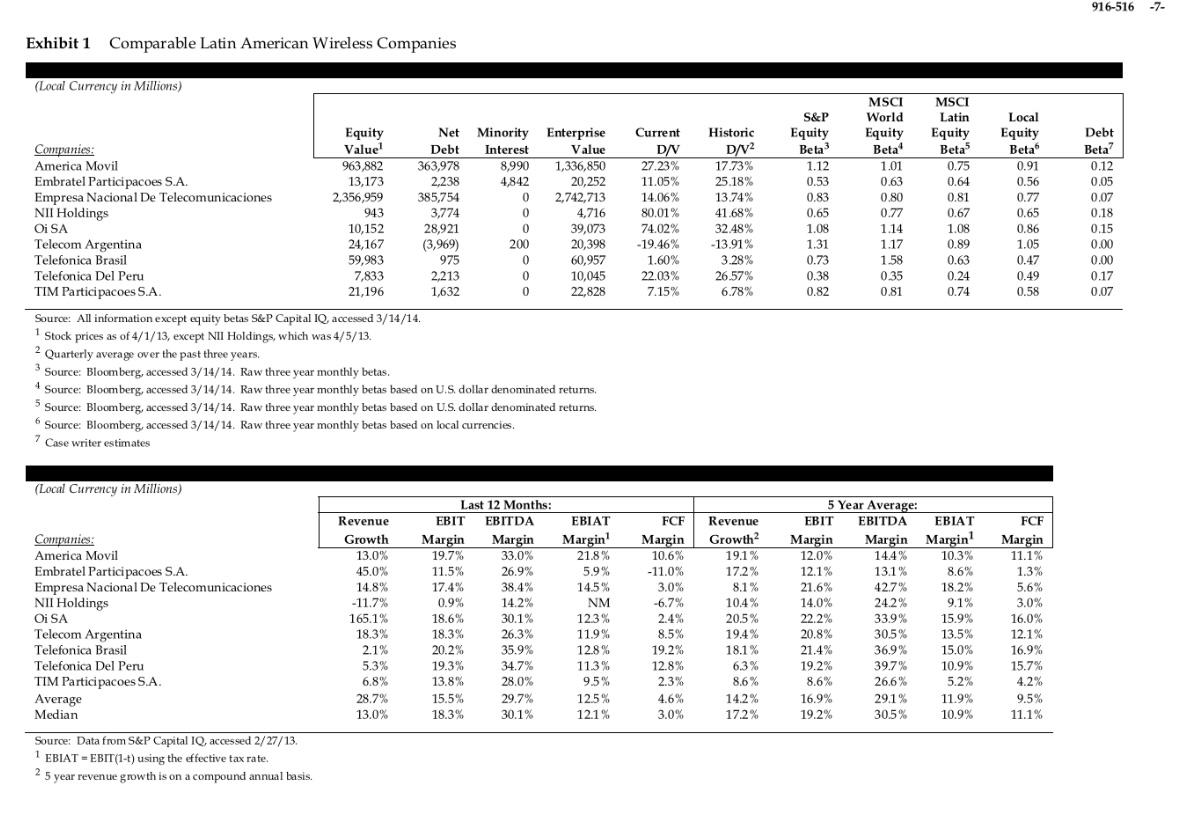 Note: NII Holdings is organized as the holding company for Nextel Communications, Inc.
916-516 -7- MSCI Latin Equity Betas % Exhibit 1 Comparable Latin American Wireless Companies (Local Currency in Millions) Equity Net Minority Enterprise Current Companies. Value! Debt Interest Value DN America Movil 963,882 363,978 8,990 1,336,850 Embratel Participacoes S.A. 13,173 2,238 4,842 20,252 W24 11.05% Empresa Nacional De Telecomunicaciones 2,356,959 385,754 0 2.742,713 14.06% NII Holdings 943 30 3,774 0 4,716 80.01% Oi SA 10,152 28,921 0 39,073 74.02% Telecom Argentina 24,167 (3,969) 200 20,398 -19.46% Telefonica Brasil 59,983 975 0 60,957 1.60% Telefonica Del Peru 7,833 2.213 0 10,045 22.03% TIM Participacoes S.A. 21,196 1.632 0 22,828 7.15% Source: All information except equity betas S&P Capital IQ accessed 3/14/14. 1 1 Stock prices as of 4/1/13, except NII Holdings, which was 4/5/13. 2 Quarterly average over the past three years, 3 Source: Bloomberg, accessed 3/14/14. Raw three year monthly betas. Source: Bloomberg, accessed 3/14/14. Raw three year monthly betas based on US dollar denominated returns. 5 Source: Bloomberg, accessed 3/14/14. Raw three year monthly betas based on U.S. dollar denominated returns. 6 Source: Bloomberg, accessed 3/14/14. Raw three year monthly betas based on local currencies. 7 Case writer estimates Historic D/V2 17.73% 25.18% 13.74% 41.68% 32.48% -13.91% 3.28% 26.57% 6.78% S&P Equity Beta 1.12 0.53 0.83 0.65 1.08 1.31 0.73 0.38 0.82 MSCI World Equity Beta" DETA 1.01 0.63 0.80 0.77 1.14 1.17 1.58 0.35 0.81 SA 0.75 0.64 0.81 0.67 1.08 0.89 0.63 0.24 0.74 Local Equity Beta Det 0.91 0.91 0.56 0.77 0.65 0.86 1.05 0.47 0.49 0.58 Debt Beta? 0.12 0,05 0.07 0.18 0.15 0.00 0.00 0.17 0.07 3 (Local Currency in Millions) Revenue Growth FCF Margin 11.1% 13.0% 8.6% 1.3% Companies: America Movil Embratel Participacoes S.A. Empresa Nacional De Telecomunicaciones NII Holdings Oi SA Telecom Argentina Telefonica Brasil Telefonica Del Peru TIM Participacoes S.A. Average Median Source: Data from S&P Capital 10, accessed 2/27/13 1 EBIATEBIT(1-t) using the effective tax rate. 2 5 year revenue growth is on a compound annual basis. 45.0% 14.8% -11.7% . 165.1% . 18.3% 2.1% 5.3% 6.8% 28.7% 13.0% Last 12 Months: EBIT EBITDA EBIAT Margin Margin Margin 19.7% 33.0% 21.8% 11.5% 26.9% 5.9% % 17.4% 17.4% 38.4% 14.5% % 0.9% 14.2% NM M 18.6% 100 30.1% 12.3% 140 18.3% 26.3% 11.9% 20.2% 35.9% 128% 19,3% 34.7% 10 113% 13.8% 28.0% 9.5% 15.5% 29.7% 125% 18.3% 30.1% 12.1% FCF Margin 10.6% -11.0% 3.0% -6.7% 2.4% 8.5% 10 19.2% 12.8% 2.3% 4.6% 3.0% Revenue Growth 19.1% 17.2% 8.1% % 10.4% 20.5% 19.4% 18.1% 6,3% 8.6% 14.2% 17.2% 5 Year Average: EBIT EBITDA EBIAT Margin Margin Margin 12.0% 14.4% 10.3% 12.1% 13.1% 21.6% 42.7% 18.2% 10.2% 14.0% 24.2% 414 9.1% 22.2% 33.9% 15.9% 102 20.8% 30.5% 13.5% 21.4% 36.9% 10 15.0% 19.2% 39.7% 10.9% 8.6% 26.6% 5.2% 16.9% 29.1% 11.9% 19.2% 30.5% 10.9% 5.6% 3.0% 16.0% 10.07 12.1% 16.9% 15.7% 4.2% 9.5% 11.1% 916-516 -7- MSCI Latin Equity Betas % Exhibit 1 Comparable Latin American Wireless Companies (Local Currency in Millions) Equity Net Minority Enterprise Current Companies. Value! Debt Interest Value DN America Movil 963,882 363,978 8,990 1,336,850 Embratel Participacoes S.A. 13,173 2,238 4,842 20,252 W24 11.05% Empresa Nacional De Telecomunicaciones 2,356,959 385,754 0 2.742,713 14.06% NII Holdings 943 30 3,774 0 4,716 80.01% Oi SA 10,152 28,921 0 39,073 74.02% Telecom Argentina 24,167 (3,969) 200 20,398 -19.46% Telefonica Brasil 59,983 975 0 60,957 1.60% Telefonica Del Peru 7,833 2.213 0 10,045 22.03% TIM Participacoes S.A. 21,196 1.632 0 22,828 7.15% Source: All information except equity betas S&P Capital IQ accessed 3/14/14. 1 1 Stock prices as of 4/1/13, except NII Holdings, which was 4/5/13. 2 Quarterly average over the past three years, 3 Source: Bloomberg, accessed 3/14/14. Raw three year monthly betas. Source: Bloomberg, accessed 3/14/14. Raw three year monthly betas based on US dollar denominated returns. 5 Source: Bloomberg, accessed 3/14/14. Raw three year monthly betas based on U.S. dollar denominated returns. 6 Source: Bloomberg, accessed 3/14/14. Raw three year monthly betas based on local currencies. 7 Case writer estimates Historic D/V2 17.73% 25.18% 13.74% 41.68% 32.48% -13.91% 3.28% 26.57% 6.78% S&P Equity Beta 1.12 0.53 0.83 0.65 1.08 1.31 0.73 0.38 0.82 MSCI World Equity Beta" DETA 1.01 0.63 0.80 0.77 1.14 1.17 1.58 0.35 0.81 SA 0.75 0.64 0.81 0.67 1.08 0.89 0.63 0.24 0.74 Local Equity Beta Det 0.91 0.91 0.56 0.77 0.65 0.86 1.05 0.47 0.49 0.58 Debt Beta? 0.12 0,05 0.07 0.18 0.15 0.00 0.00 0.17 0.07 3 (Local Currency in Millions) Revenue Growth FCF Margin 11.1% 13.0% 8.6% 1.3% Companies: America Movil Embratel Participacoes S.A. Empresa Nacional De Telecomunicaciones NII Holdings Oi SA Telecom Argentina Telefonica Brasil Telefonica Del Peru TIM Participacoes S.A. Average Median Source: Data from S&P Capital 10, accessed 2/27/13 1 EBIATEBIT(1-t) using the effective tax rate. 2 5 year revenue growth is on a compound annual basis. 45.0% 14.8% -11.7% . 165.1% . 18.3% 2.1% 5.3% 6.8% 28.7% 13.0% Last 12 Months: EBIT EBITDA EBIAT Margin Margin Margin 19.7% 33.0% 21.8% 11.5% 26.9% 5.9% % 17.4% 17.4% 38.4% 14.5% % 0.9% 14.2% NM M 18.6% 100 30.1% 12.3% 140 18.3% 26.3% 11.9% 20.2% 35.9% 128% 19,3% 34.7% 10 113% 13.8% 28.0% 9.5% 15.5% 29.7% 125% 18.3% 30.1% 12.1% FCF Margin 10.6% -11.0% 3.0% -6.7% 2.4% 8.5% 10 19.2% 12.8% 2.3% 4.6% 3.0% Revenue Growth 19.1% 17.2% 8.1% % 10.4% 20.5% 19.4% 18.1% 6,3% 8.6% 14.2% 17.2% 5 Year Average: EBIT EBITDA EBIAT Margin Margin Margin 12.0% 14.4% 10.3% 12.1% 13.1% 21.6% 42.7% 18.2% 10.2% 14.0% 24.2% 414 9.1% 22.2% 33.9% 15.9% 102 20.8% 30.5% 13.5% 21.4% 36.9% 10 15.0% 19.2% 39.7% 10.9% 8.6% 26.6% 5.2% 16.9% 29.1% 11.9% 19.2% 30.5% 10.9% 5.6% 3.0% 16.0% 10.07 12.1% 16.9% 15.7% 4.2% 9.5% 11.1%
Step by Step Solution
There are 3 Steps involved in it

Get step-by-step solutions from verified subject matter experts