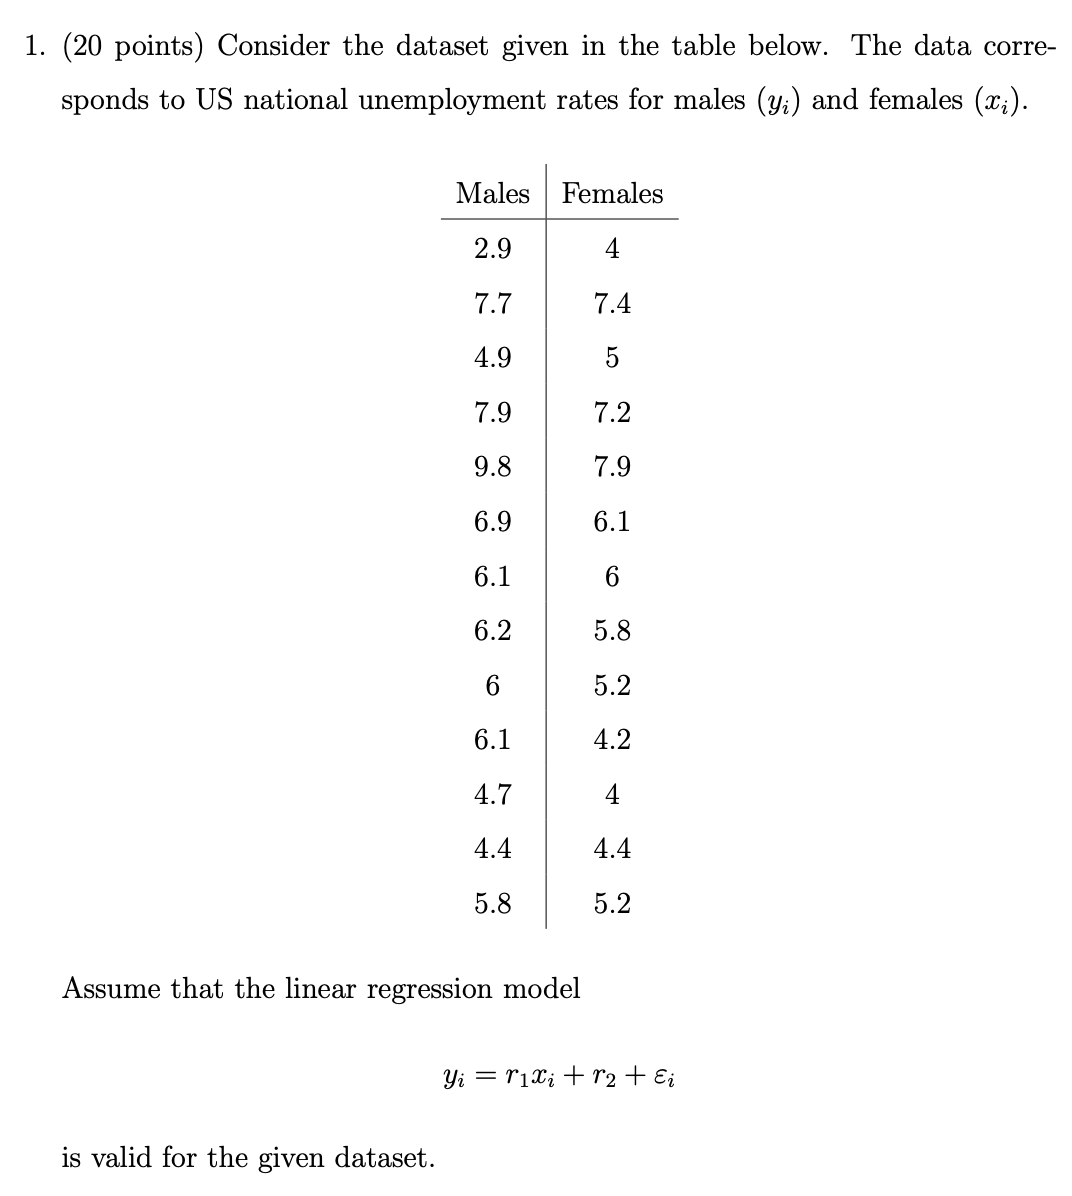
Question: 1. (20 points) Consider the dataset given in the table below. The data corre- sponds to US national unemployment rates for males (y;) and


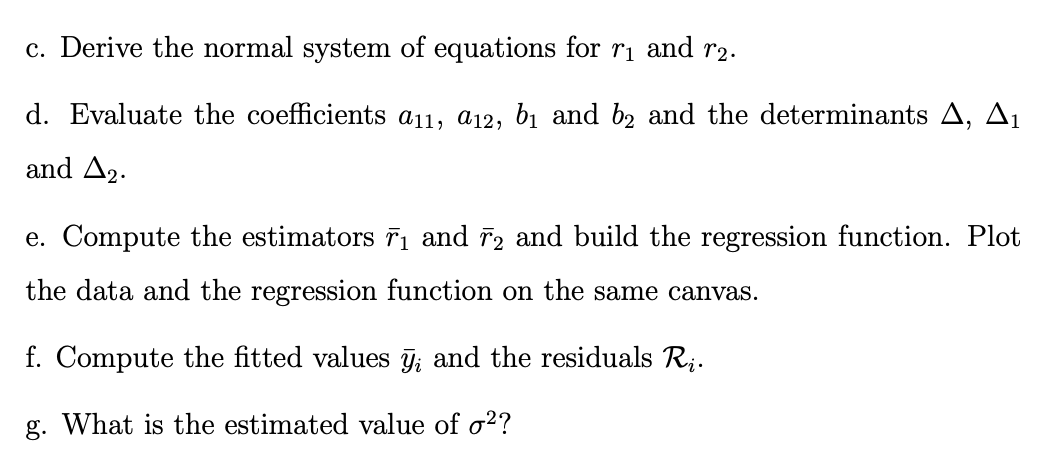
1. (20 points) Consider the dataset given in the table below. The data corre- sponds to US national unemployment rates for males (y;) and females (x). Males Females 2.9 4 7.7 7.4 4.9 5 7.9 7.2 9.8 7.9 6.9 6.1 6.1 6 6.2 5.8 6 5.2 6.1 4.2 4.7 4 4.4 4.4 5.8 5.2 Assume that the linear regression model is valid for the given dataset. Yirixir + i c. Derive the normal system of equations for r and r2. d. Evaluate the coefficients a11, a12, b and b and the determinants A, A1 and A2. e. Compute the estimators 71 and 72 and build the regression function. Plot the data and the regression function on the same canvas. f. Compute the fitted values ; and the residuals Ri. g. What is the estimated value of ?
Step by Step Solution
There are 3 Steps involved in it

Get step-by-step solutions from verified subject matter experts


