Question: 1. (25 points). The following question is based on a data set called Fuel Economy that you can find on LEO. The U.S. Department of
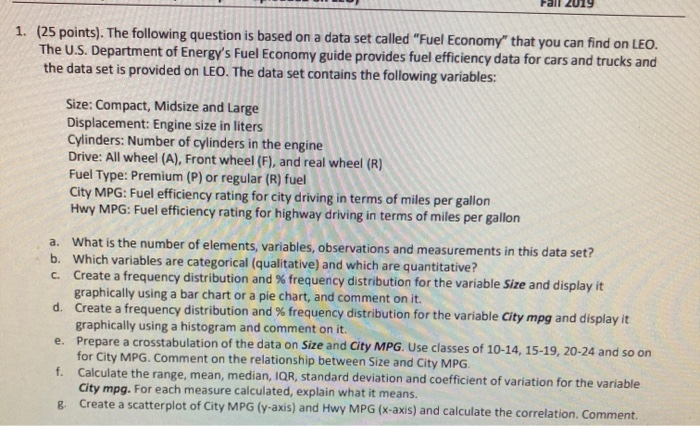
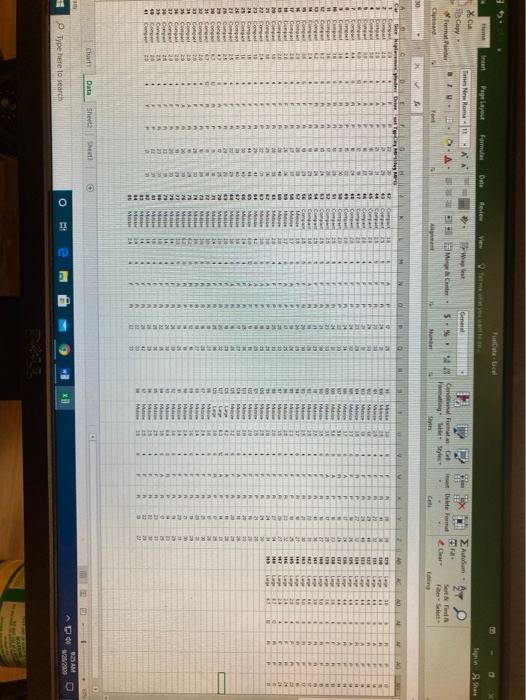
1. (25 points). The following question is based on a data set called "Fuel Economy" that you can find on LEO. The U.S. Department of Energy's Fuel Economy guide provides fuel efficiency data for cars and trucks and the data set is provided on LEO. The data set contains the following variables: Size: Compact, Midsize and Large Displacement: Engine size in liters Cylinders: Number of cylinders in the engine Drive: All wheel (A), Front wheel (F), and real wheel (R) Fuel Type: Premium (P) or regular (R) fuel City MPG: Fuel efficiency rating for city driving in terms of miles per gallon Hwy MPG: Fuel efficiency rating for highway driving in terms of miles per gallon a. What is the number of elements, variables, observations and measurements in this data set? b. Which variables are categorical (qualitative) and which are quantitative? C. Create a frequency distribution and % frequency distribution for the variable Size and display it graphically using a bar chart or a pie chart, and comment on it. d. Create a frequency distribution and % frequency distribution for the variable City mpg and display it graphically using a histogram and comment on it. e. Prepare a crosstabulation of the data on Size and City MPG. Use classes of 10-14, 15-19, 20-24 and so on for City MPG. Comment on the relationship between Size and City MPG. f. Calculate the range, mean, median, IQR, standard deviation and coefficient of variation for the variable City mpg. For each measure calculated, explain what it means. & Create a scatterplot of City MPG (y-axis) and Hwy MPG (X-axis) and calculate the correlation. Comment. Fultace Home Page Layout Format Data Review View Times New Roma AA Wala Xcu fe Copy Format LINE Auto- 2vo MC 5- Insert Delete Format Con el Foming table Styles Styr Cipboard Sort & Find a Fier-Select- Eating www C 30 M N OY with 2+ 16 1 A P R N en 10 ca are high Com 2 2 Com Com A A cm + . 21 CH Comp Com 25 10 25 20 1 5 130 42 44 45 4 67 16 3 1 TE P 3 Lp 10 M 29 + 44 44 4 P . 10 10 14 15 40 44 44 10 . 1 Lp Lp R Come Com Ci Copii Com C Com SE 90 201 1 M M M 15 se 1 1 1 1 21 11 20 21 Lp 29 SE 35 24 20 119 1 12 P 2 1 11 . Com Con COM Com Com Com Com Compa M We We M M 24 1 1 2 54 55 56 + N 13 10 18 M M M M M M M M 5 C Corre Corp Com C Com 17 18 11 4 4 HE 24 . 20 20 4 25 20 10 www SH He 20 1 20 25 . 42 21 16 23 28 25 26 41 4 + Mi M M M M M 20 + + CA sh 11 11 16 25 25 4 BE FE + 20 COM Com Com Com Do Com Com Com Co Com COM Com . 30 20 1 L LE M M M 2 . . 2 LE 20 24 16 20 A 20 BE 30 35 36 12 38 24 M M M MH M M MIN M MU M M. M M M M MO M M 4 4 4 4 20 20 23 13 20 22 20 20 8 N N M 21 2 Com C C Com Com 75 M M M 40 22 82 20 20 + M e HE os CE Chart Data Sheet2 Sheet O Type here to search E RI 9:25 AM 92/2000 1. (25 points). The following question is based on a data set called "Fuel Economy" that you can find on LEO. The U.S. Department of Energy's Fuel Economy guide provides fuel efficiency data for cars and trucks and the data set is provided on LEO. The data set contains the following variables: Size: Compact, Midsize and Large Displacement: Engine size in liters Cylinders: Number of cylinders in the engine Drive: All wheel (A), Front wheel (F), and real wheel (R) Fuel Type: Premium (P) or regular (R) fuel City MPG: Fuel efficiency rating for city driving in terms of miles per gallon Hwy MPG: Fuel efficiency rating for highway driving in terms of miles per gallon a. What is the number of elements, variables, observations and measurements in this data set? b. Which variables are categorical (qualitative) and which are quantitative? C. Create a frequency distribution and % frequency distribution for the variable Size and display it graphically using a bar chart or a pie chart, and comment on it. d. Create a frequency distribution and % frequency distribution for the variable City mpg and display it graphically using a histogram and comment on it. e. Prepare a crosstabulation of the data on Size and City MPG. Use classes of 10-14, 15-19, 20-24 and so on for City MPG. Comment on the relationship between Size and City MPG. f. Calculate the range, mean, median, IQR, standard deviation and coefficient of variation for the variable City mpg. For each measure calculated, explain what it means. & Create a scatterplot of City MPG (y-axis) and Hwy MPG (X-axis) and calculate the correlation. Comment. Fultace Home Page Layout Format Data Review View Times New Roma AA Wala Xcu fe Copy Format LINE Auto- 2vo MC 5- Insert Delete Format Con el Foming table Styles Styr Cipboard Sort & Find a Fier-Select- Eating www C 30 M N OY with 2+ 16 1 A P R N en 10 ca are high Com 2 2 Com Com A A cm + . 21 CH Comp Com 25 10 25 20 1 5 130 42 44 45 4 67 16 3 1 TE P 3 Lp 10 M 29 + 44 44 4 P . 10 10 14 15 40 44 44 10 . 1 Lp Lp R Come Com Ci Copii Com C Com SE 90 201 1 M M M 15 se 1 1 1 1 21 11 20 21 Lp 29 SE 35 24 20 119 1 12 P 2 1 11 . Com Con COM Com Com Com Com Compa M We We M M 24 1 1 2 54 55 56 + N 13 10 18 M M M M M M M M 5 C Corre Corp Com C Com 17 18 11 4 4 HE 24 . 20 20 4 25 20 10 www SH He 20 1 20 25 . 42 21 16 23 28 25 26 41 4 + Mi M M M M M 20 + + CA sh 11 11 16 25 25 4 BE FE + 20 COM Com Com Com Do Com Com Com Co Com COM Com . 30 20 1 L LE M M M 2 . . 2 LE 20 24 16 20 A 20 BE 30 35 36 12 38 24 M M M MH M M MIN M MU M M. M M M M MO M M 4 4 4 4 20 20 23 13 20 22 20 20 8 N N M 21 2 Com C C Com Com 75 M M M 40 22 82 20 20 + M e HE os CE Chart Data Sheet2 Sheet O Type here to search E RI 9:25 AM 92/2000