

Question: 1 3 4 8 5 11 2 13 10 9 9 14 The following table shows the actual demand observed over the last 11 years
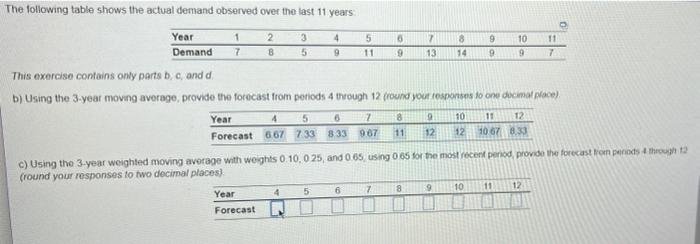
1 3 4 8 5 11 2 13 10 9 9 14 The following table shows the actual demand observed over the last 11 years Year 2 9 11 Demand 7 8 5 9 9 7 This exerciso contains only parts b,c, and d, b) Using the 3-year moving average provide the forecast from periods 4 through 12 ground your responses toon dicima 6 8 11 12 Forecast 667 733 333 907 11 12 10 67830 C) Using the 3-year weighted moving average with weights 0.100 25 and 0.65 using 065 for the most recent period provide the forecast from penods through t2 (round your responses to two decimal places) 12 Year 9 Forecast RD Year 4 5 7 10 12 6 4 5 7 8 10 11
Step by Step Solution
There are 3 Steps involved in it
1 Expert Approved Answer
Step: 1 Unlock

Question Has Been Solved by an Expert!
Get step-by-step solutions from verified subject matter experts
Step: 2 Unlock
Step: 3 Unlock