

Question: (1) 3. Adjust the viewing rectangle to contain the two points found in #1, making sure that all of the d-values from #2 are included.
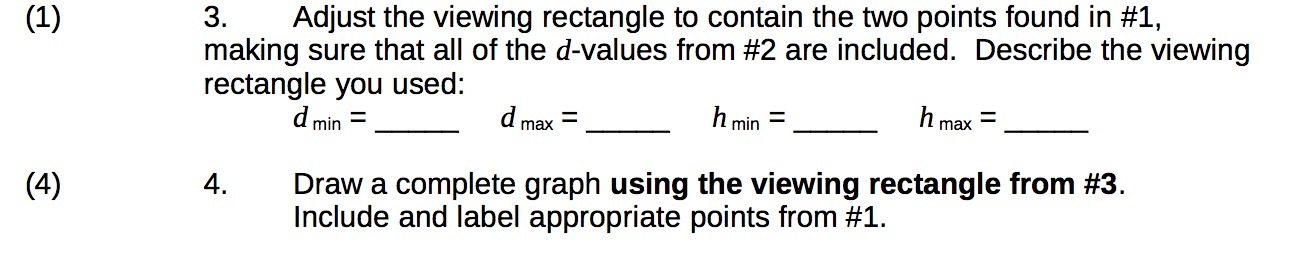
(1) 3. Adjust the viewing rectangle to contain the two points found in #1, making sure that all of the d-values from #2 are included. Describe the viewing rectangle you used: d min = d max = h min = h max = (4) 4. Draw a complete graph using the viewing rectangle from #3. Include and label appropriate points from #1
Step by Step Solution
There are 3 Steps involved in it
1 Expert Approved Answer
Step: 1 Unlock

Question Has Been Solved by an Expert!
Get step-by-step solutions from verified subject matter experts
Step: 2 Unlock
Step: 3 Unlock