

Question: 1. {3 marks) Consider the following final grade distributions from two different high school History classes, plotted using side-by-side boxplots: Final Grade (%) Class 3.

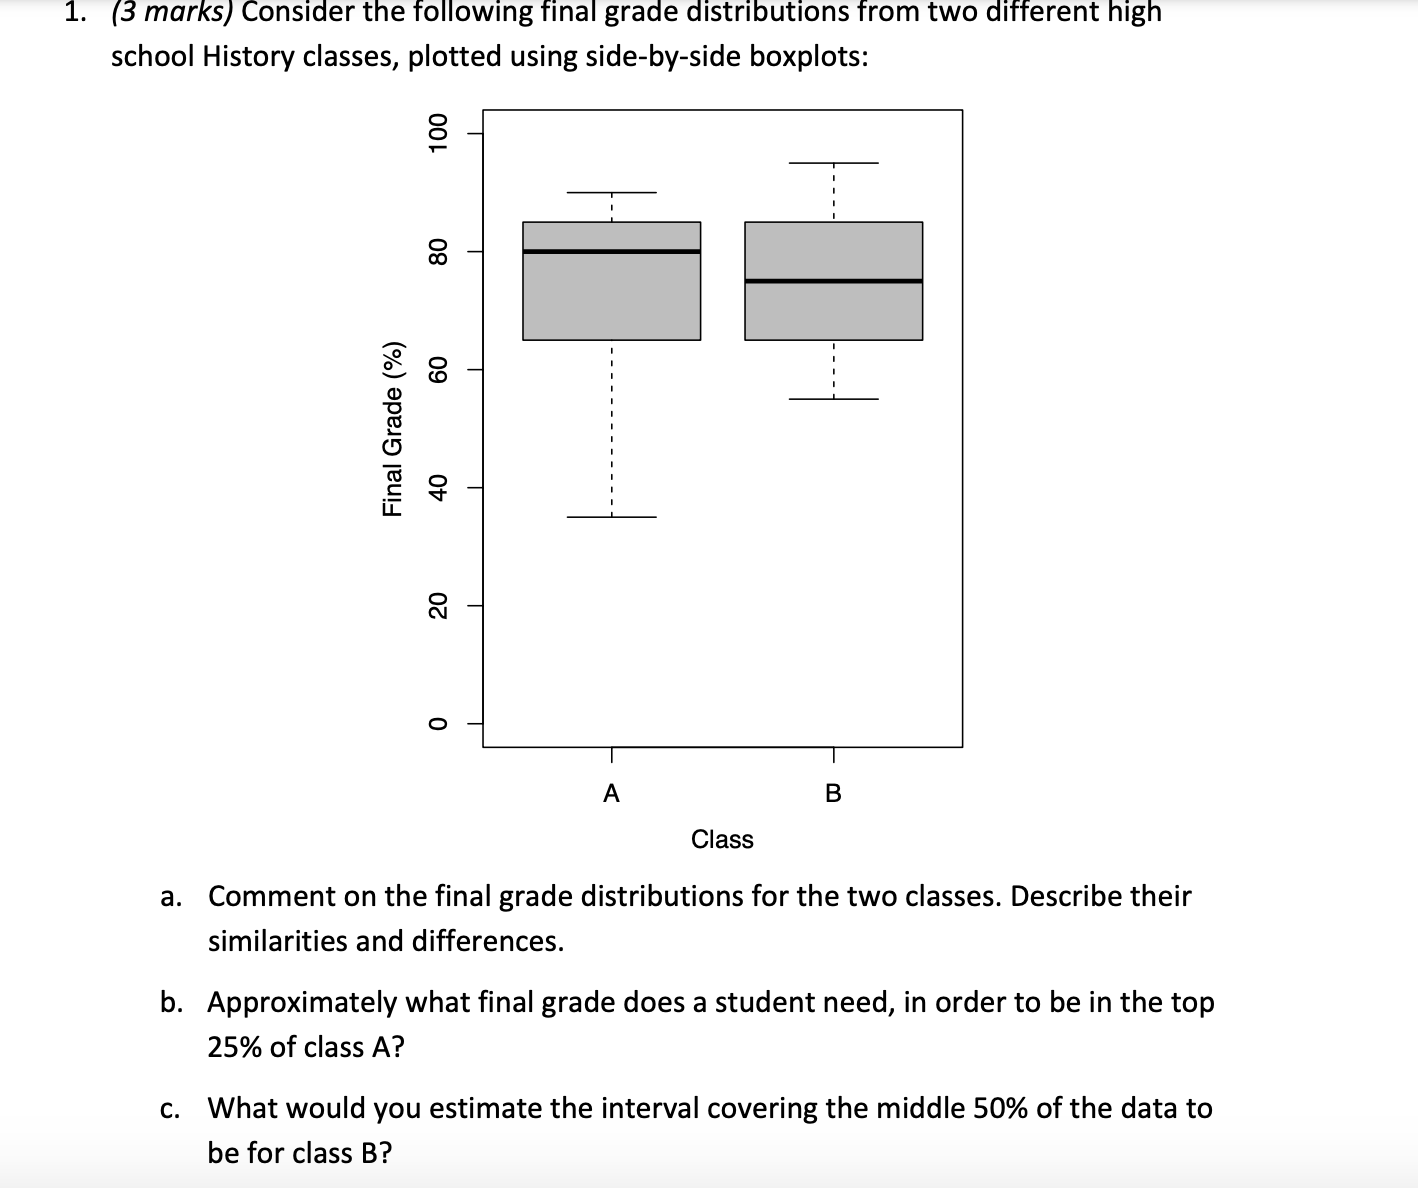
1. {3 marks) Consider the following final grade distributions from two different high school History classes, plotted using side-by-side boxplots: Final Grade (%) Class 3. Comment on the final grade distributions for the two classes. Describe their similarities and differences. b. Approximately what nal grade does a student need, in order to be in the top 25% of class A? c. What would you estimate the interval covering the middle 50% of the data to be for class B
Step by Step Solution
There are 3 Steps involved in it
1 Expert Approved Answer
Step: 1 Unlock

Question Has Been Solved by an Expert!
Get step-by-step solutions from verified subject matter experts
Step: 2 Unlock
Step: 3 Unlock