

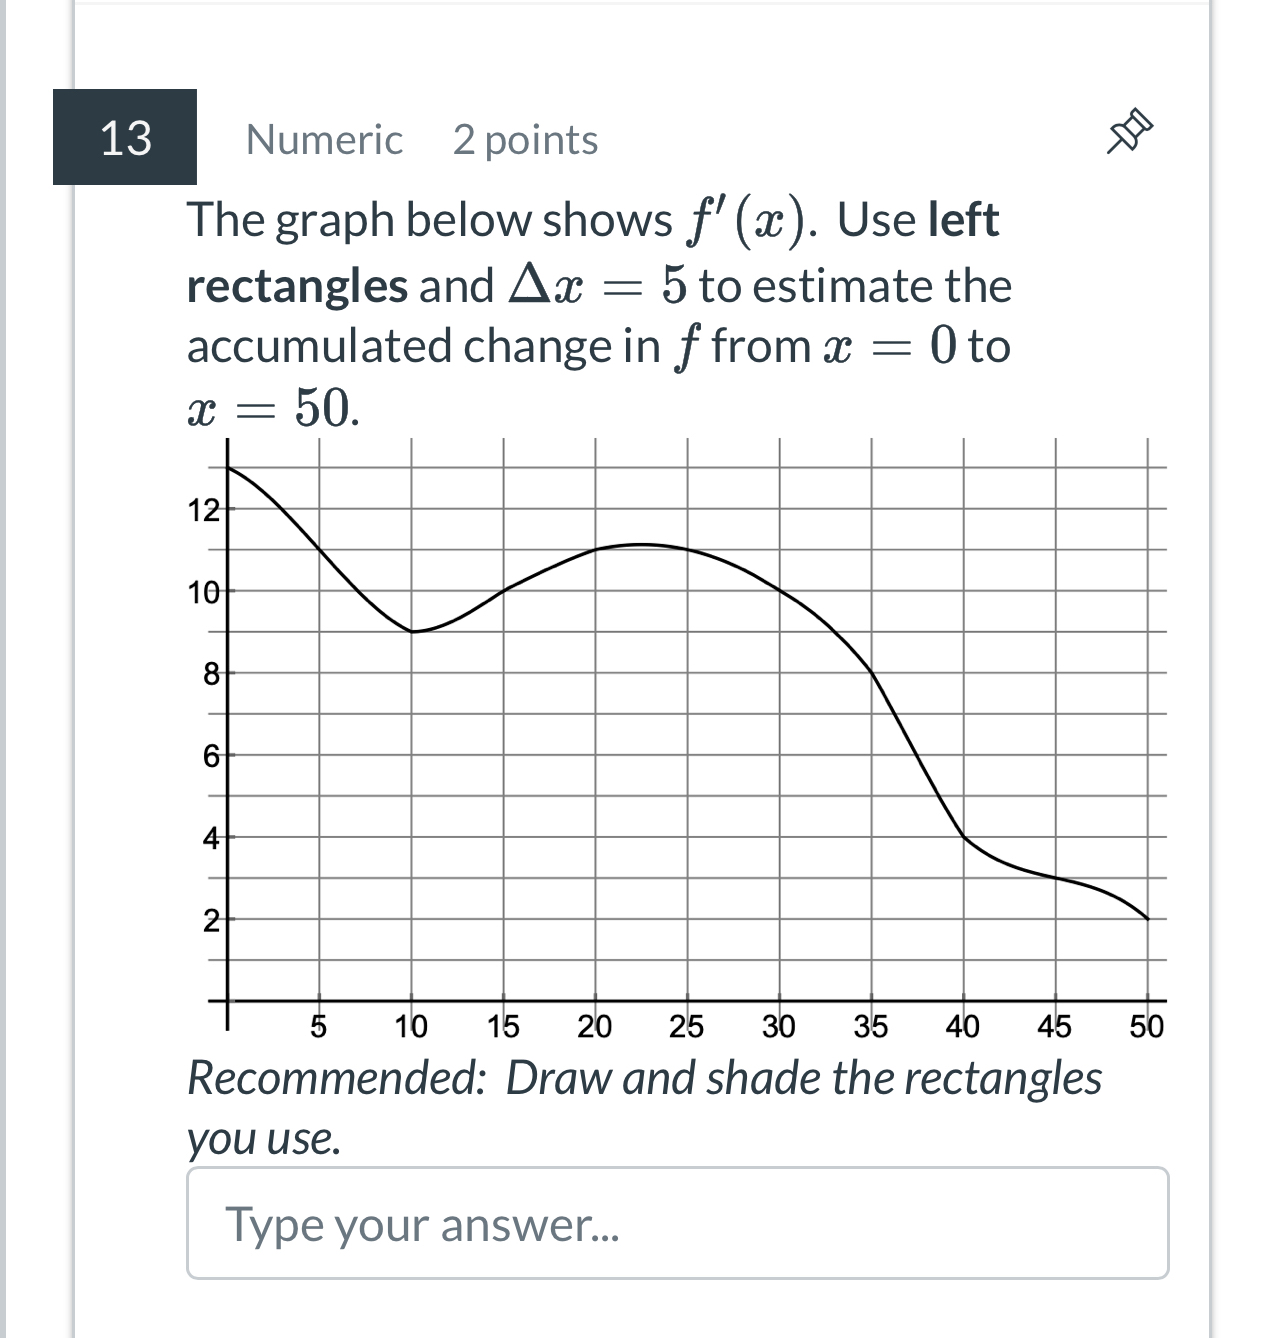
Question: 1 3 Numeric 2 points The graph below shows f ' ( x ) . Use left rectangles and x = 5 to estimate the
Numeric
points
The graph below shows Use left rectangles and to estimate the accumulated change in from to
Recommended: Draw and shade the rectangles you use.
Step by Step Solution
There are 3 Steps involved in it
1 Expert Approved Answer
Step: 1 Unlock

Question Has Been Solved by an Expert!
Get step-by-step solutions from verified subject matter experts
Step: 2 Unlock
Step: 3 Unlock