

Question: 1) (3 points each) Classify the following variables as categorical, quantitative, ordinal, or as an identifier. a) Index Finger Length b) Least Favorite Day of
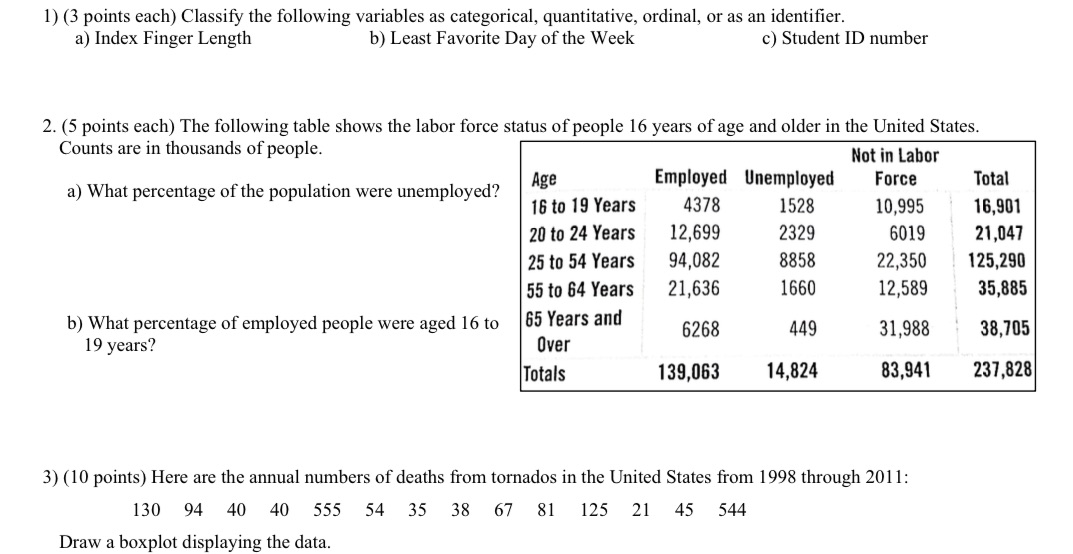
1) (3 points each) Classify the following variables as categorical, quantitative, ordinal, or as an identifier. a) Index Finger Length b) Least Favorite Day of the Week c) Student ID number 2. (5 points each) The following table shows the labor force status of people 16 years of age and older in the United States. Counts are in thousands of people. Not in Labor a) What percentage of the population were unemployed? Age Employed Unemployed Force Total 16 to 19 Years 4378 1528 10,995 16,901 20 to 24 Years 12,699 2329 6019 21,047 25 to 54 Years 94,082 8858 22,350 125,290 55 to 64 Years 21,636 1660 12,589 35,885 b) What percentage of employed people were aged 16 to 65 Years and 6268 449 31,988 38,705 19 years? Over Totals 139,063 14,824 83,941 237,828 3) (10 points) Here are the annual numbers of deaths from tornados in the United States from 1998 through 201 1: 130 94 40 40 555 54 35 38 67 81 125 21 45 544 Draw a boxplot displaying the data
Step by Step Solution
There are 3 Steps involved in it

Get step-by-step solutions from verified subject matter experts