

Question: 1. (3 points) The scatterplot below represents students' grades based on the time they spent watching TV. Students' grades on exam, based on time
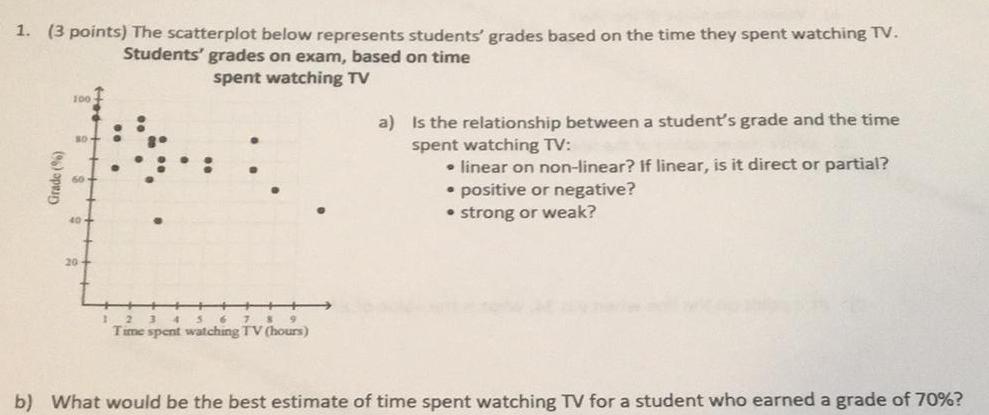
1. (3 points) The scatterplot below represents students' grades based on the time they spent watching TV. Students' grades on exam, based on time Grade (%) 100 spent watching TV a) Is the relationship between a student's grade and the time spent watching TV: linear on non-linear? If linear, is it direct or partial? positive or negative? strong or weak? I 2 3 4 5 6 7 8 9 Time spent watching TV (hours) b) What would be the best estimate of time spent watching TV for a student who earned a grade of 70%?
Step by Step Solution
There are 3 Steps involved in it
1 Expert Approved Answer
Step: 1 Unlock

Question Has Been Solved by an Expert!
Get step-by-step solutions from verified subject matter experts
Step: 2 Unlock
Step: 3 Unlock