

Question: (1, 35 utils) 30 ' (3, 25 utils) 20 l (5, 15 utils) (7, 10 utils) 1o 0 2 4 6 8 10 12 14

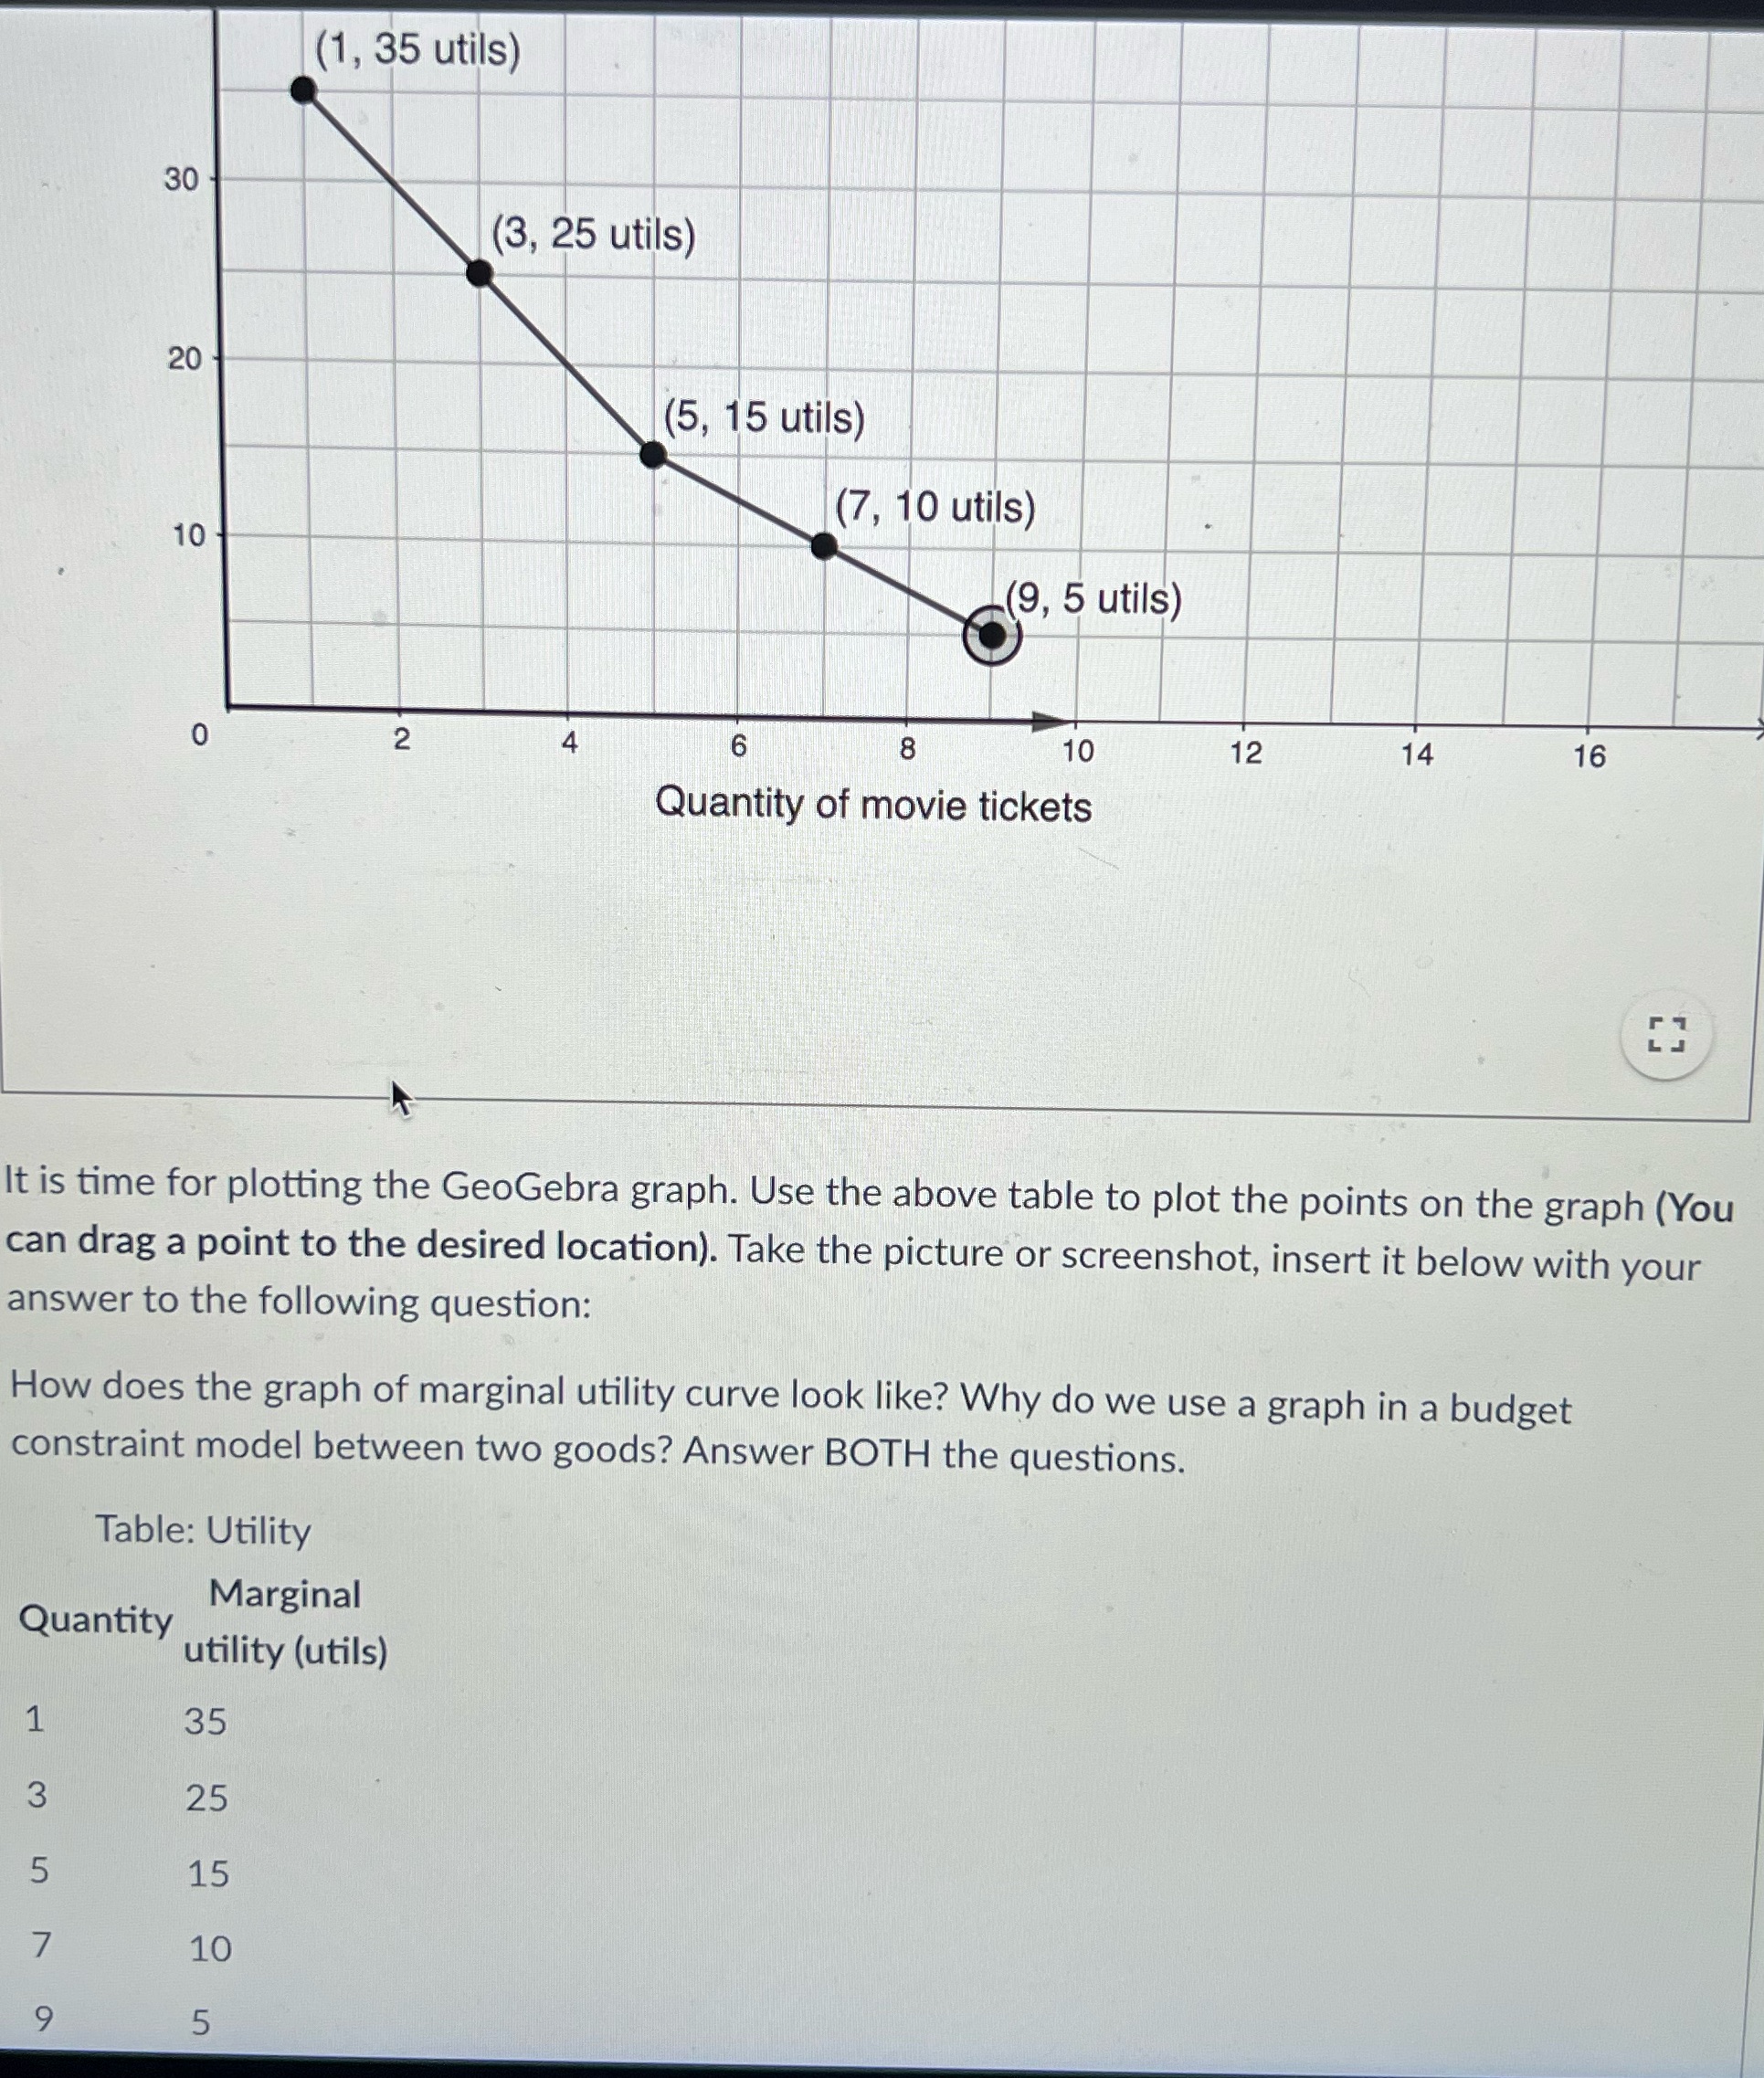
(1, 35 utils) 30 ' (3, 25 utils) 20 l (5, 15 utils) (7, 10 utils) 1o 0 2 4 6 8 10 12 14 16 Quantity of movie tickets It is time for plotting the GeoGebra graph. Use the above table to plot the points on the graph (You can drag a point to the desired location). Take the picture or screenshot, insert it below with your answer to the following question: How does the graph of marginal utility curve look like? Why do we use a graph in a budget constraint model between two goods? Answer BOTH the questions. Table: Utility Marginal utility (utils) 35 Quantity 1 3 25 5 15 7 10 9 5 _
Step by Step Solution
There are 3 Steps involved in it
1 Expert Approved Answer
Step: 1 Unlock

Question Has Been Solved by an Expert!
Get step-by-step solutions from verified subject matter experts
Step: 2 Unlock
Step: 3 Unlock