Question: 1. (40 points) The demand pattern for an automotive spare part, namely DCWS657 follows a decreasing trend demand pattern, due to the introduction of new
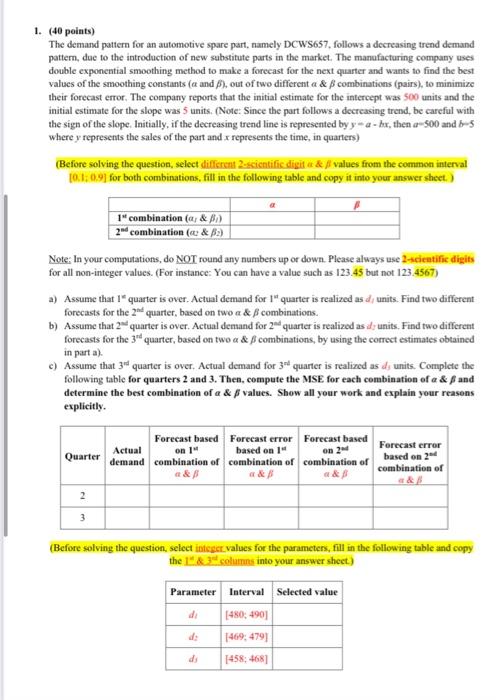
1. (40 points) The demand pattern for an automotive spare part, namely DCWS657 follows a decreasing trend demand pattern, due to the introduction of new substitute parts in the market. The manufacturing company uses double exponential smoothing method to make a forecast for the next quarter and wants to find the best values of the smoothing constants (a and ), out of two different a & $ combinations (pairs), to minimize their forecast error. The company reports that the initial estimate for the intercept was 500 units and the initial estimate for the slope was 5 units. (Note: Since the part follows a decreasing trend, be careful with the sign of the slope. Initially, if the decreasing trend line is represented by ya-hx, then a 500 and 5 where y represents the sales of the part and x represents the time, in quarters) (Before solving the question, select different 2-scientific digit it & f values from the common interval 10,1:09 for both combinations, fill in the following table and copy it into your answer sheet) 1" combination (a/ & A 2 combination (& $:) Note: In your computations, do NOT round any numbers up or down. Please always use 2-scientific digits for all non-integer values. (For instance: You can have a value such as 123.45 but not 123.4567) a) Assume that 1* quarter is over. Actual demand for 1" quarter is realized as d units. Find two different forecasts for the 2 quarter, based on two a & B combinations b) Assume that 2 quarter is over. Actual demand for 2nd quarter is realized as al units. Find two different forecasts for the 3 quarter, based on two a & combinations, by using the correct estimates obtained in part a). C) Assume that 34 quarter is over. Actual demand for 3 quarter is realized as d units. Complete the following table for quarters 2 and 3. Then, compute the MSE for each combination of a & Band determine the best combination of a & p values. Show all your work and explain your reasons explicitly. on 2 Quarter Forecast based Forecast error Forecast based Actual on 1 based on 1 demand combination of combination of combination of & a& Forecast crror based on 2 combination of & 2 3 (Before solving the question, select integer values for the parameters, fill in the following table and copy the 1&3 columns into your answer sheet) Parameter Interval Selected value (480: 4901 d 1469: 4791 d 1458,4681 1. (40 points) The demand pattern for an automotive spare part, namely DCWS657 follows a decreasing trend demand pattern, due to the introduction of new substitute parts in the market. The manufacturing company uses double exponential smoothing method to make a forecast for the next quarter and wants to find the best values of the smoothing constants (a and ), out of two different a & $ combinations (pairs), to minimize their forecast error. The company reports that the initial estimate for the intercept was 500 units and the initial estimate for the slope was 5 units. (Note: Since the part follows a decreasing trend, be careful with the sign of the slope. Initially, if the decreasing trend line is represented by ya-hx, then a 500 and 5 where y represents the sales of the part and x represents the time, in quarters) (Before solving the question, select different 2-scientific digit it & f values from the common interval 10,1:09 for both combinations, fill in the following table and copy it into your answer sheet) 1" combination (a/ & A 2 combination (& $:) Note: In your computations, do NOT round any numbers up or down. Please always use 2-scientific digits for all non-integer values. (For instance: You can have a value such as 123.45 but not 123.4567) a) Assume that 1* quarter is over. Actual demand for 1" quarter is realized as d units. Find two different forecasts for the 2 quarter, based on two a & B combinations b) Assume that 2 quarter is over. Actual demand for 2nd quarter is realized as al units. Find two different forecasts for the 3 quarter, based on two a & combinations, by using the correct estimates obtained in part a). C) Assume that 34 quarter is over. Actual demand for 3 quarter is realized as d units. Complete the following table for quarters 2 and 3. Then, compute the MSE for each combination of a & Band determine the best combination of a & p values. Show all your work and explain your reasons explicitly. on 2 Quarter Forecast based Forecast error Forecast based Actual on 1 based on 1 demand combination of combination of combination of & a& Forecast crror based on 2 combination of & 2 3 (Before solving the question, select integer values for the parameters, fill in the following table and copy the 1&3 columns into your answer sheet) Parameter Interval Selected value (480: 4901 d 1469: 4791 d 1458,4681