

Question: 1. (45 points) Please calculate the expected returns for Vanguard Long-term Investment Grade fund. (a) Please calculate the expected returns for both of the funds
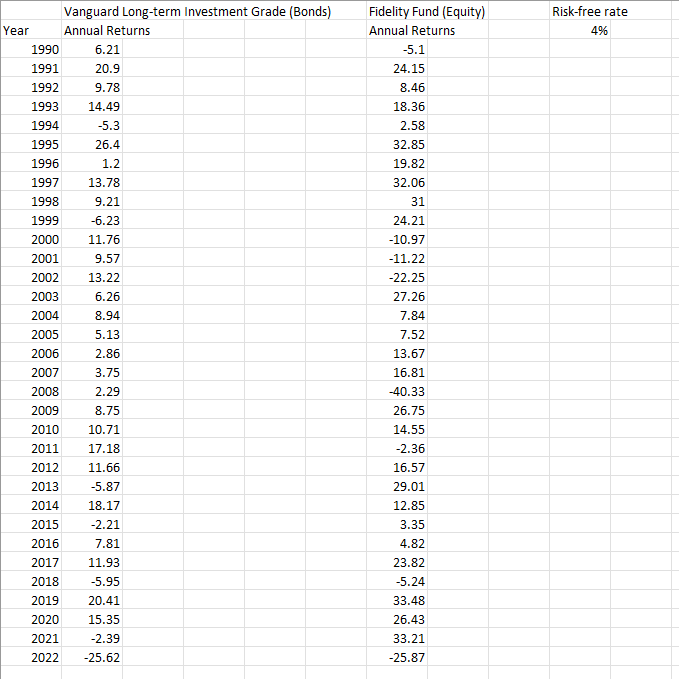
1. (45 points) Please calculate the expected returns for Vanguard Long-term Investment Grade fund. (a) Please calculate the expected returns for both of the funds individually. (b) Please calculate the standard deviation of annual returns for both of the funds individually. (c) Please calculate the Sharpe ratios for both of the funds individually. (d) Please calculate the correlation coefficient between the two funds. (e) Please calculate the proportions for each of the funds in the optimal risky portfolio. (f) Please calculate the expected returns for the optimal risky portfolio. (g) Please calculate the standard deviation of returns for the optimal risky portfolio. (h) Please calculate the Sharpe ratio for the optimal risky portfolio. (i) Lastly, please calculate the proportion of the complete portfolio that would be the risky portfolio if your client had a risk-aversion score (A) equal to 2 . \begin{tabular}{|c|c|c|c|c|} \hline & Vanguard Long- & Investment Grade (Bonds) & Fidelity Fund (Equity) & Risk-free rate \\ \hline Year & Annual Returns & & Annual Returns & 4% \\ \hline 1990 & 6.21 & & -5.1 & \\ \hline 1991 & 20.9 & & 24.15 & \\ \hline 1992 & 9.78 & & 8.46 & \\ \hline 1993 & 14.49 & & 18.36 & \\ \hline 1994 & -5.3 & & 2.58 & \\ \hline 1995 & 26.4 & & 32.85 & \\ \hline 1996 & 1.2 & & 19.82 & \\ \hline 1997 & 13.78 & & 32.06 & \\ \hline 1998 & 9.21 & & 31 & \\ \hline 1999 & -6.23 & & 24.21 & \\ \hline 2000 & 11.76 & & -10.97 & \\ \hline 2001 & 9.57 & & -11.22 & \\ \hline 2002 & 13.22 & & -22.25 & \\ \hline 2003 & 6.26 & & 27.26 & \\ \hline 2004 & 8.94 & & 7.84 & \\ \hline 2005 & 5.13 & & 7.52 & \\ \hline 2006 & 2.86 & & 13.67 & \\ \hline 2007 & 3.75 & & 16.81 & \\ \hline 2008 & 2.29 & & -40.33 & \\ \hline 2009 & 8.75 & & 26.75 & \\ \hline 2010 & 10.71 & & 14.55 & \\ \hline 2011 & 17.18 & & -2.36 & \\ \hline 2012 & 11.66 & & 16.57 & \\ \hline 2013 & -5.87 & & 29.01 & \\ \hline 2014 & 18.17 & & 12.85 & \\ \hline 2015 & -2.21 & & 3.35 & \\ \hline 2016 & 7.81 & & 4.82 & \\ \hline 2017 & 11.93 & & 23.82 & \\ \hline 2018 & -5.95 & & -5.24 & \\ \hline 2019 & 20.41 & & 33.48 & \\ \hline 2020 & 15.35 & & 26.43 & \\ \hline 2021 & -2.39 & & 33.21 & \\ \hline 2022 & -25.62 & & -25.87 & \\ \hline \end{tabular}
Step by Step Solution
There are 3 Steps involved in it

Get step-by-step solutions from verified subject matter experts