

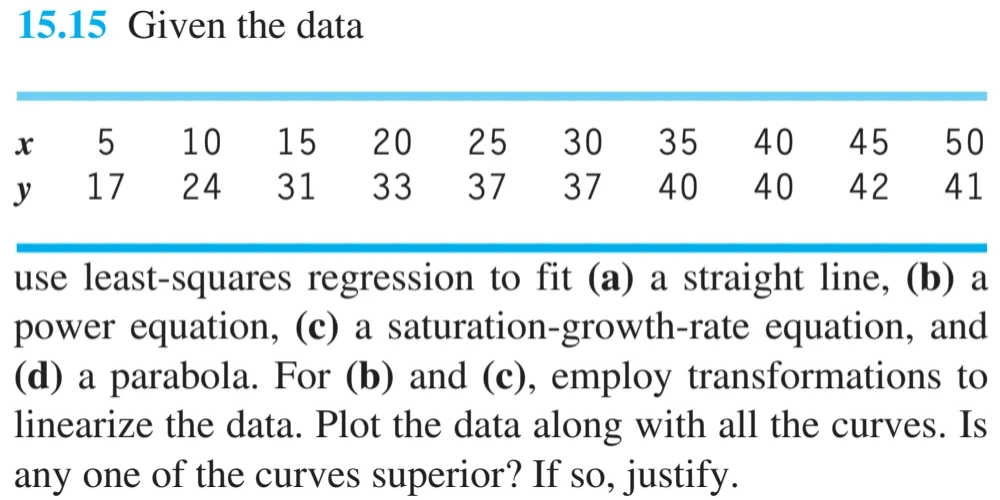
Question: 1 5 . 1 5 Given the data table [ [ x , 5 , 1 0 , 1 5 , 2 0 ,
Given the data
table
use leastsquares regression to fit a a straight line, b a power equation, c a saturationgrowthrate equation, and d a parabola. For b and c employ transformations to linearize the data. Plot the data along with all the curves. Is any one of the curves superior? If so justify.
Step by Step Solution
There are 3 Steps involved in it
1 Expert Approved Answer
Step: 1 Unlock

Question Has Been Solved by an Expert!
Get step-by-step solutions from verified subject matter experts
Step: 2 Unlock
Step: 3 Unlock