

Question: 1 5 10 20 30 Maturity (Years) Yield (%) 3.6 5.5 5.5 4.2 4.0 On the following graph, plot the yield curve implied by these

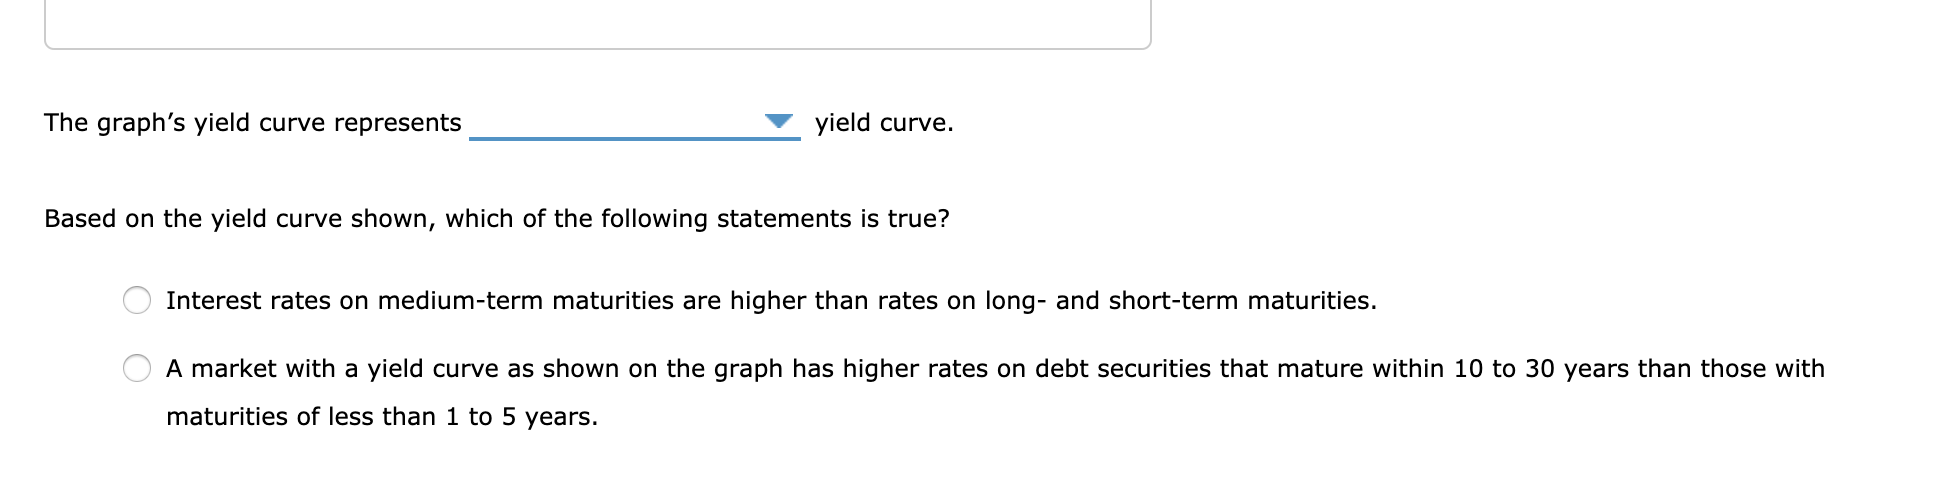
1 5 10 20 30 Maturity (Years) Yield (%) 3.6 5.5 5.5 4.2 4.0 On the following graph, plot the yield curve implied by these interest rates. Place a blue point (circle symbol) at each maturity and interest rate in the table, and the yield curve will draw itself. (? 10 9 Yield Curve 8 7 INTEREST RATE (Percent) 2 1 0 0 5 25 30 10 15 20 MATURITY (Years) The graph's yield curve represents yield curve. Based on the yield curve shown, which of the following statements is true? Interest rates on medium-term maturities are higher than rates on long- and short-term maturities. A market with a yield curve as shown on the graph has higher rates on debt securities that mature within 10 to 30 years than those with maturities of less than 1 to 5 years
Step by Step Solution
There are 3 Steps involved in it

Get step-by-step solutions from verified subject matter experts