

Question: ( 1 5 points ) The graph below is the graph of the derivative of the function f ( x ) . So , the
points
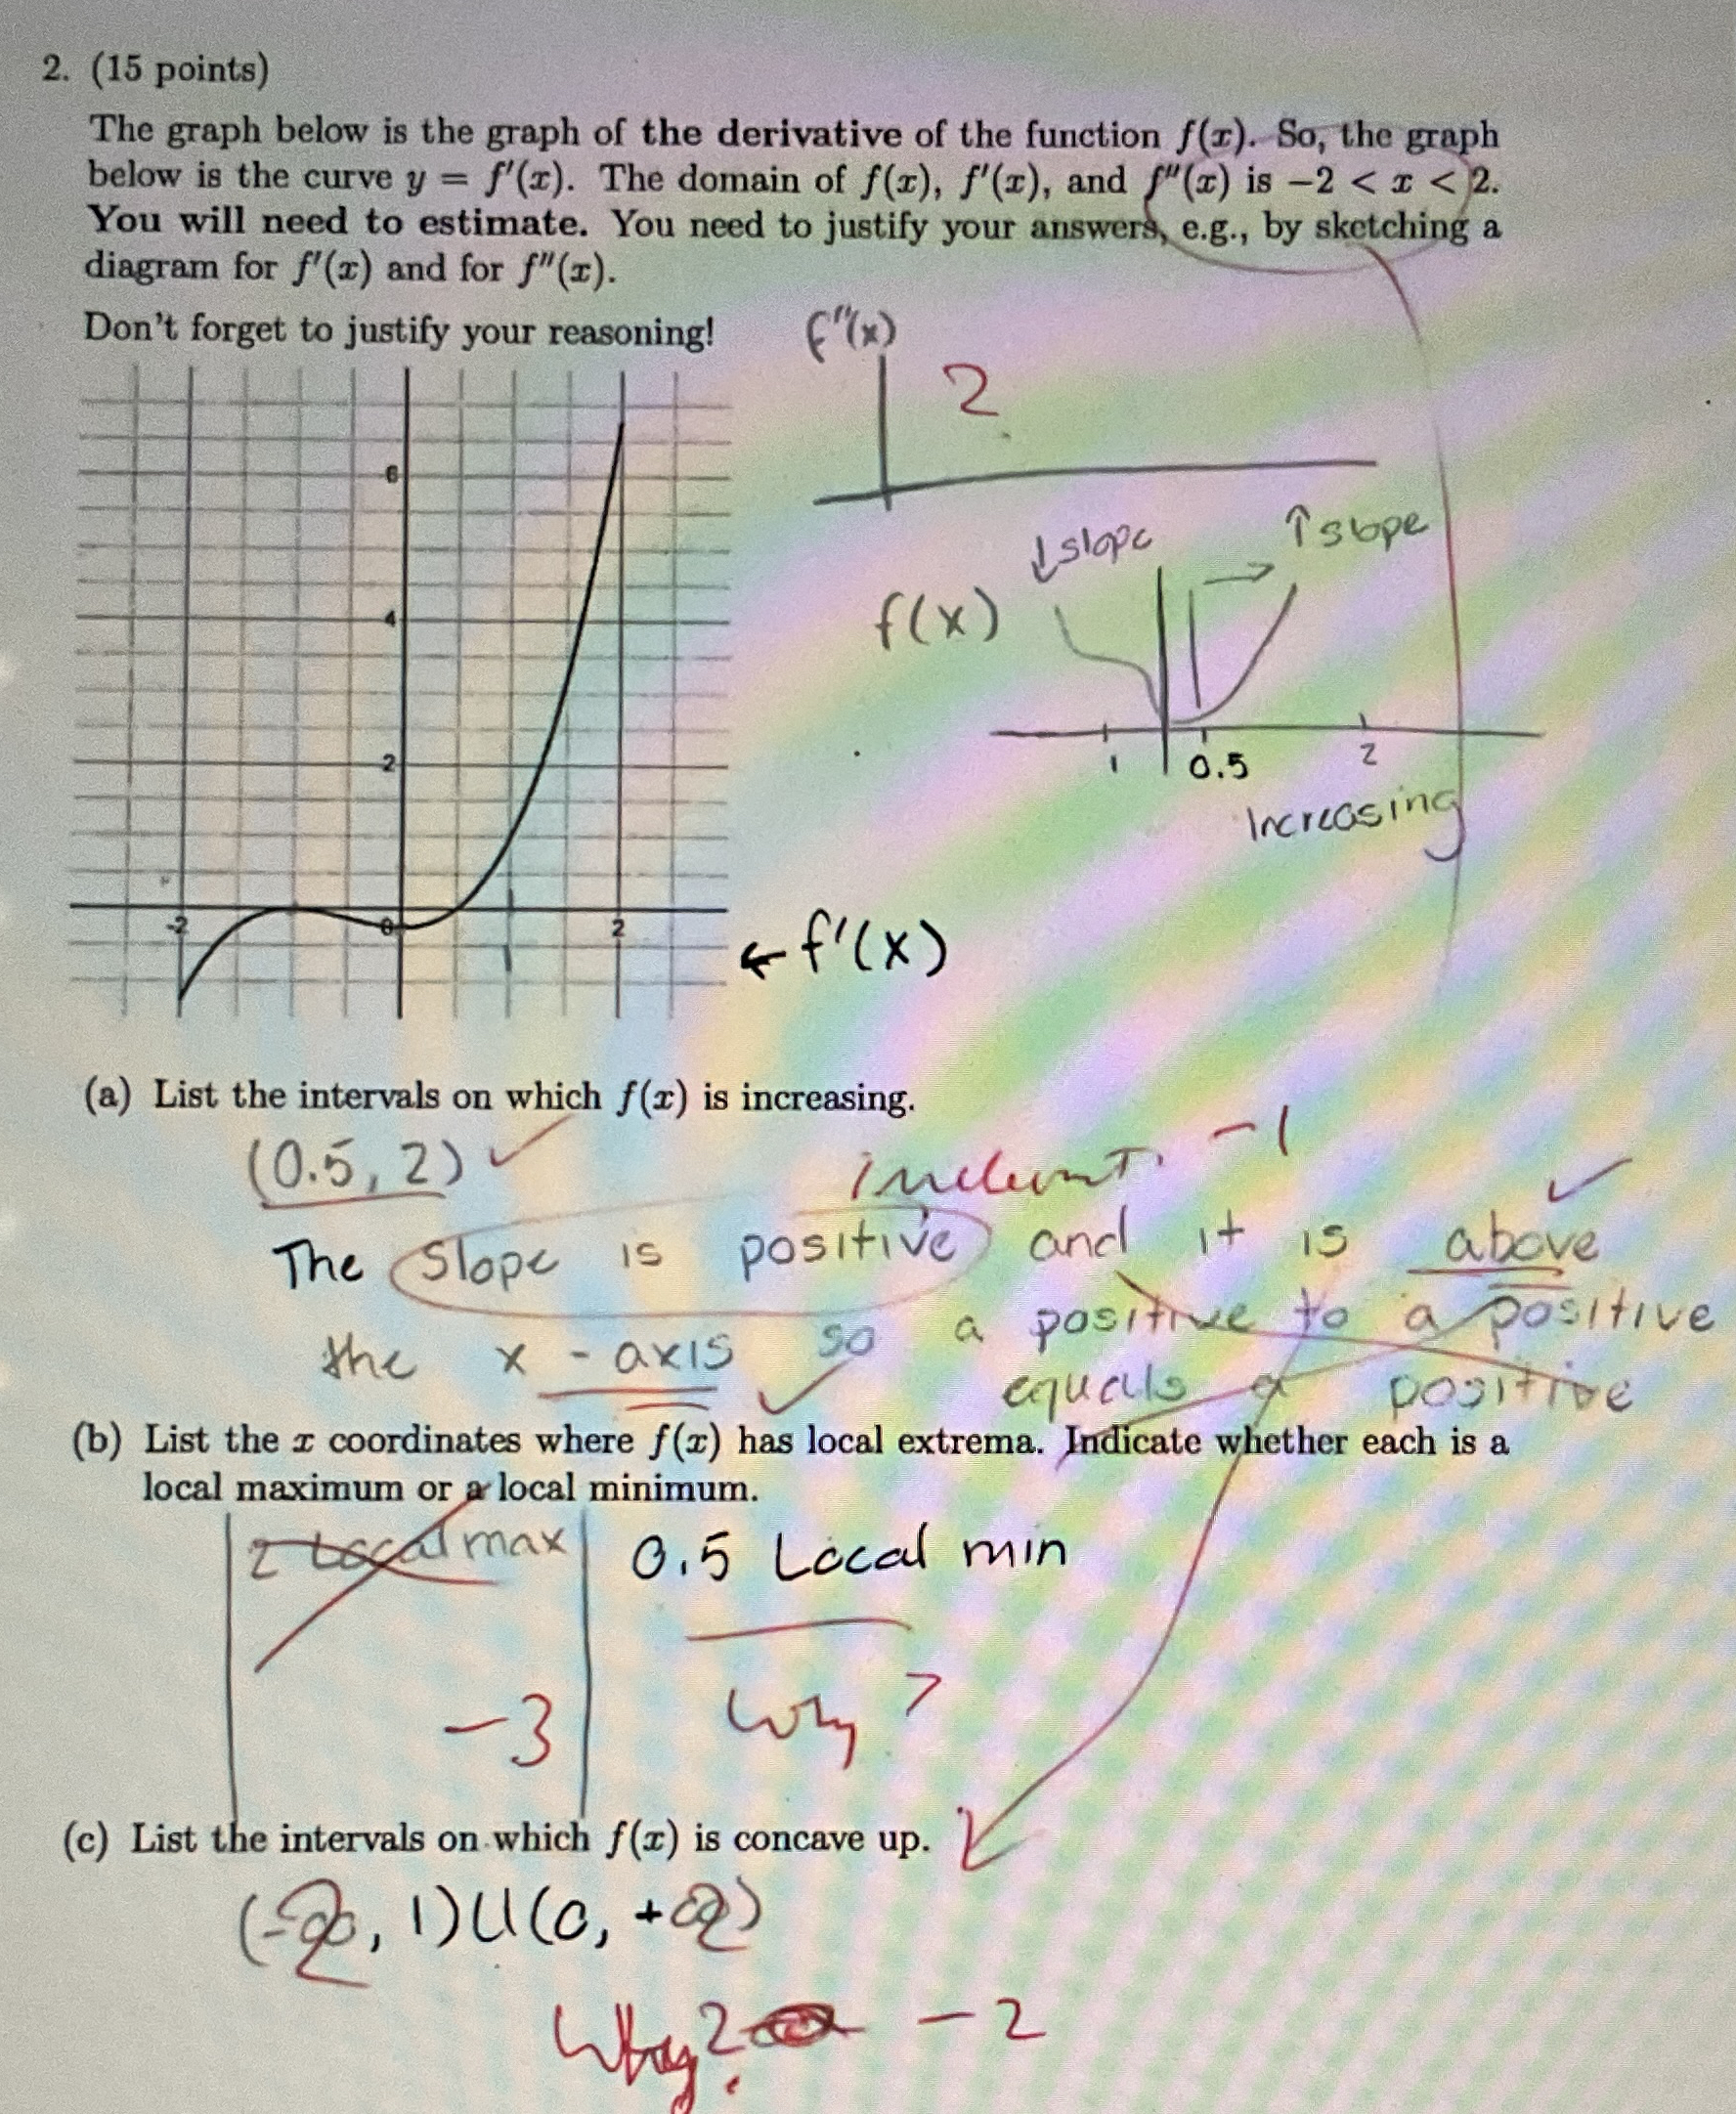
The graph below is the graph of the derivative of the function So the graph below is the curve The domain of and is
You will need estimate. You need justify your answers, sketching a diagram for and for
Don't forget instify vour reasenninal
List the intervals which increasing.
indeunt
The Slope positive and above the axis a positive a positive
List the coordinates where has local extrema. Indicate whether each a local maximum a local minimum.
List the intervals which concave
Step by Step Solution
There are 3 Steps involved in it
1 Expert Approved Answer
Step: 1 Unlock

Question Has Been Solved by an Expert!
Get step-by-step solutions from verified subject matter experts
Step: 2 Unlock
Step: 3 Unlock