

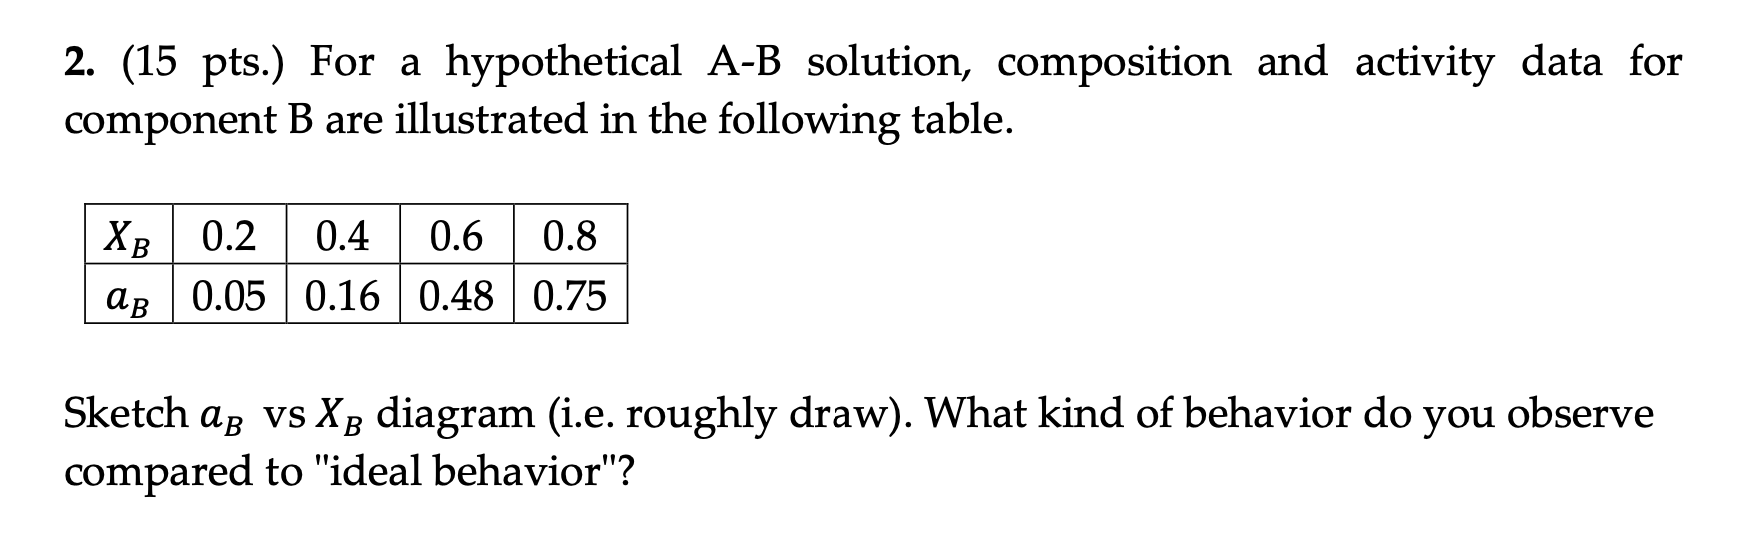
Question: ( 1 5 pts . ) For a hypothetical A - B solution, composition and activity data for component B are illustrated in the following
pts For a hypothetical AB solution, composition and activity data for
component are illustrated in the following table.
Sketch vs diagram ie roughly draw What kind of behavior do you observe
compared to "ideal behavior"?
Step by Step Solution
There are 3 Steps involved in it
1 Expert Approved Answer
Step: 1 Unlock

Question Has Been Solved by an Expert!
Get step-by-step solutions from verified subject matter experts
Step: 2 Unlock
Step: 3 Unlock