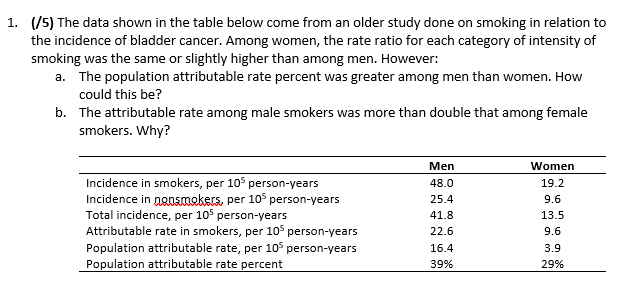
Question: 1. (/5) The data shown in the table below come from an older study done on smoking in relation to the incidence of bladder cancer.

1. (/5) The data shown in the table below come

1. (/5) The data shown in the table below come from an older study done on smoking in relation to the incidence of bladder cancer. Among women, the rate ratio for each category of intensity of smoking was the same or slightly higher than among men. However: a. The population attributable rate percent was greater among men than women. How could this be? b. The attributable rate among male smokers was more than double that among female smokers. Why? Incidence in smokers, per 10 person-years Incidence in ngnsmokers, per 10 person-years Total incidence, per 10 person-years Attributable rate in smokers, per 10 person-years Population attributable rate, per 10 person-years Population attributable rate percent Men 48.0 25.4 41.8 22.6 16.4 39% Women 19.2 9.6 13.5 9.6 3.9 29%

Step by Step Solution

There are 3 Steps involved in it

1 Expert Approved Answer
Step: 1 Unlock blur-text-image
Question Has Been Solved by an Expert!

Get step-by-step solutions from verified subject matter experts

Step: 2 Unlock
Step: 3 Unlock

Students Have Also Explored These Related General Management Questions!