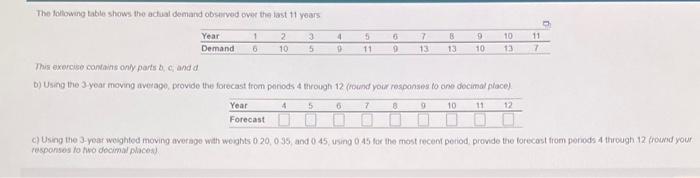
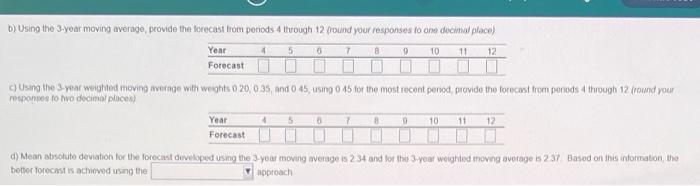
Question: 1 6 2 10 3 5 5 11 5 9 7 13 B 13 9 10 10 13 11 7 The following table shows the

1 6 2 10 3 5 5 11 5 9 7 13 B 13 9 10 10 13 11 7
1 6 2 10 3 5 5 11 5 9 7 13 B 13 9 10 10 13 11 7 The following table shows the actual demand observed over the last 11 years Year 4 Demand This exercise contains only parts , o, and a b) Using the 3 ybar moving average, provide the forecast from panoce rough 12 (round your responses to cre decimal place) 5 6 7 10 11 12 Forecast c) Using the 3-year weighted moving average with weights 0 20 0 35 and 045 using 0.45 for the most recent period, provide the forecast from porods4through 12 (round your responses to o docimal places) Year 4 4 7 8 11 b) Using the 3-year moving average, provide the forecast from periods 4 through 12 (round your responses to one decimal place) Year 5 9 10 12 Forecast C) Using the 3. your weighted moving average with weights 0 20 0 35, and 0 45, using 0.45 for the most recent penod, provide the forecast from penods 4 through 12 (round your responses to two decimal place) Year 4 5 7 8 11 12 Forecast d) Mean absoluto deviation for the forecast developed using the 3-year moving average is 2 34 and for the year weighted moving average is 237 Based on this information to better forecast is achieved using the approach 5 0 10

Step by Step Solution

There are 3 Steps involved in it

1 Expert Approved Answer
Step: 1 Unlock blur-text-image
Question Has Been Solved by an Expert!

Get step-by-step solutions from verified subject matter experts

Step: 2 Unlock
Step: 3 Unlock

Students Have Also Explored These Related General Management Questions!