

Question: 1 6 . 2 a . Given that there is a regular solution between components A and B , plot the Gibbs FIGURE 1 6
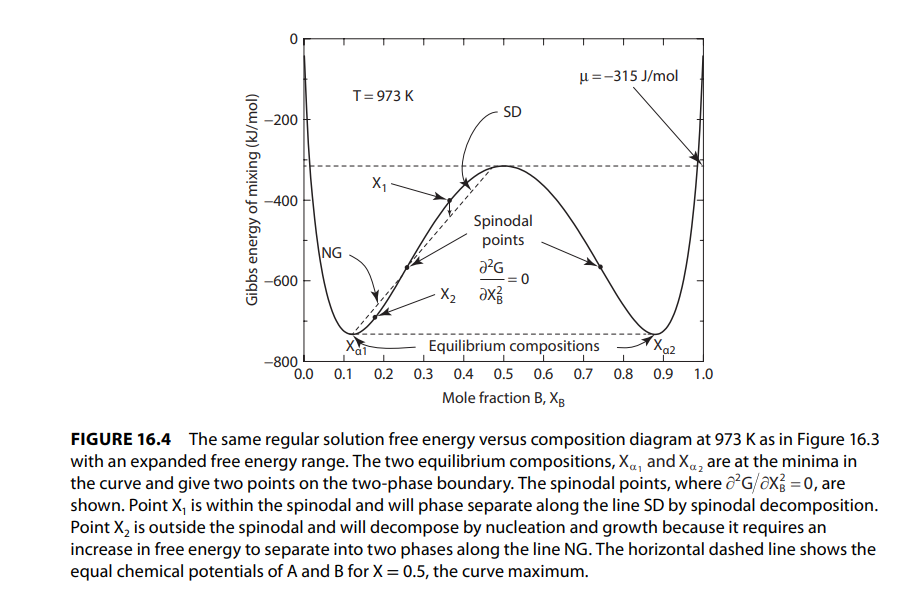
a Given that there is a regular solution between components A and B plot the Gibbs FIGURE The same regular solution free energy versus composition diagram at as in Figure with an expanded free energy range. The two equilibrium compositions, and are at the minima in the curve and give two points on the twophase boundary. The spinodal points, where are shown. Point is within the spinodal and will phase separate along the line SD by spinodal decomposition. Point is outside the spinodal and will decompose by nucleation and growth because it requires an increase in free energy to separate into two phases along the line NG The horizontal dashed line shows the equal chemical potentials of A and for the curve maximum.
energycomposition curve Figure versus XB at K if Gamma Jmol
b Calculate the values of XB at the two equilibrium concentrations.
c Calculate the values of XB at the two spinodal points.
d Calculate the chemical potentials of A and B at XB
e Calculate the values of the spinodal points and the phase boundary from T K to
the maximum temperature at K intervals
Step by Step Solution
There are 3 Steps involved in it
1 Expert Approved Answer
Step: 1 Unlock

Question Has Been Solved by an Expert!
Get step-by-step solutions from verified subject matter experts
Step: 2 Unlock
Step: 3 Unlock