

Question: 1 6. Probability Frequency Tables Thus far, you have worked with data sets that have already been summarized for you. But what do ye do
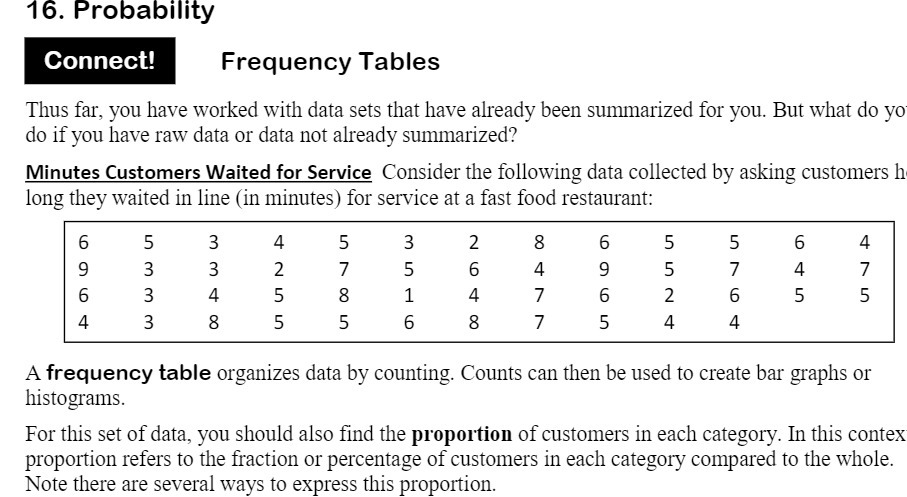
1 6. Probability Frequency Tables Thus far, you have worked with data sets that have already been summarized for you. But what do ye do if you have raw data or data not already summarized? Minutes Customers Waited for Service Consider the following data collected by asking customers h: long they waited in line (in minutes) for service at a fast food testaurant: A frequency table organizes data by counting. Counts can then he used to create bar graphs or histograms. For this set of data, you should also nd the proportion of customers in each category. In this contex proportion refers to the fraction or percentage of customers in each category compared to the whole. Note there are several ways to express this proportion
Step by Step Solution
There are 3 Steps involved in it

Get step-by-step solutions from verified subject matter experts