

Question: 1 6a) Assuming that the expectations theory is the correct theory of the term structure, calculate the interest rates in the term structure for maturities
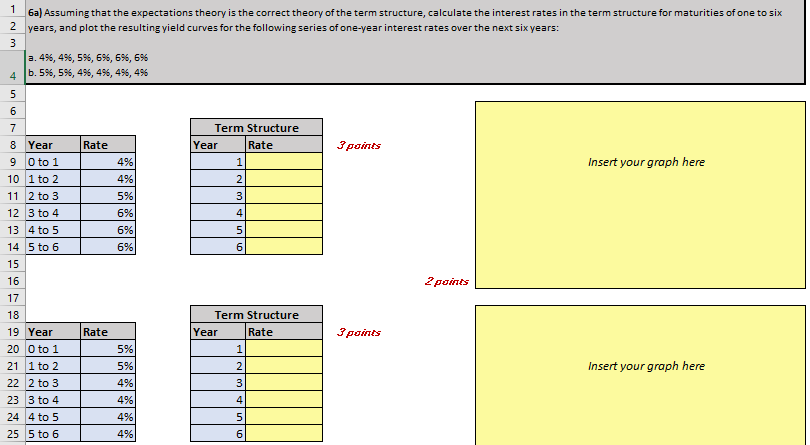
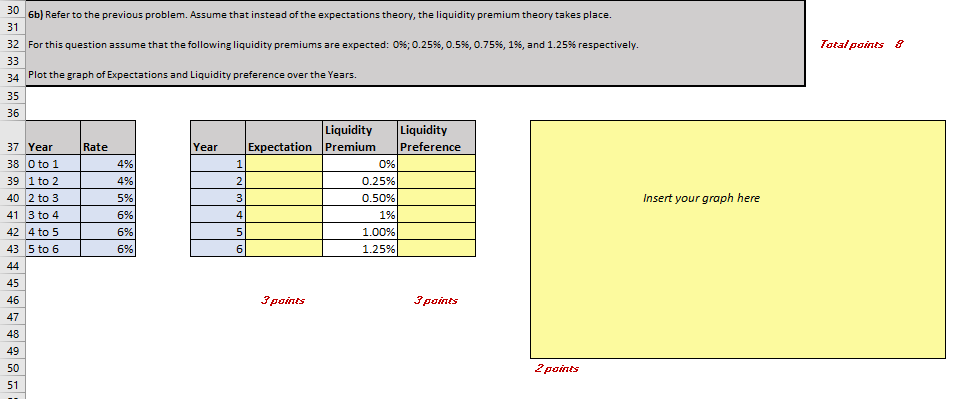
1 6a) Assuming that the expectations theory is the correct theory of the term structure, calculate the interest rates in the term structure for maturities of one to six years, and plot the resulting yield curves for the following series of one-year interest rates over the next six years: 2 3 a. 4%, 4%, 5%, 6%, 6%, 6% b. 5%, 5%, 49,49,49,496 4 5 6 7 Rate Term Structure Year Rate 1 3 3 points Insert your graph here 2 3 8 Year 90 to 1 10 1 to 2 11 2 to 3 12 3 to 4 13 4 to 5 14 5 to 6 15 16 17 18 4% 4% 5% 6% 6% 6% 4 5 6 2 points Term Structure Year Rate Rate 3 points 1 19 Year 20 O to 1 21 1 to 2 22 2 to 3 23 3 to 4 24 4 to 5 25 5 to 6 2 3 Insert your graph here 5% 5% 4% 4% 4% 4% 4 5 6 30 6b) Refer to the previous problem. Assume that instead of the expectations theory, the liquidity premium theory takes place. 31 32 For this question assume that the following liquidity premiums are expected: 096; 0.25%, 0.5%, 0.75%, 1%, and 1.25% respectively. 33 34 Plot the graph of Expectations and Liquidity preference over the years. Total points 8 35 36 Rate Year 37 Year 38 0 to 1 39 1 to 2 40 2 to 3 4% 4% 5% 6% 6%) 6% Liquidity Liquidity Expectation Premium Preference 1 0% 2 2 0.25% 3 0.50%) 4 1% 5 1.00% 61 1.25% Insert your graph here 41 3 to 4 42 4 to 5 43 5 to 6 44 45 46 47 3 points 3 points 48 49 50 51 2 points 1 6a) Assuming that the expectations theory is the correct theory of the term structure, calculate the interest rates in the term structure for maturities of one to six years, and plot the resulting yield curves for the following series of one-year interest rates over the next six years: 2 3 a. 4%, 4%, 5%, 6%, 6%, 6% b. 5%, 5%, 49,49,49,496 4 5 6 7 Rate Term Structure Year Rate 1 3 3 points Insert your graph here 2 3 8 Year 90 to 1 10 1 to 2 11 2 to 3 12 3 to 4 13 4 to 5 14 5 to 6 15 16 17 18 4% 4% 5% 6% 6% 6% 4 5 6 2 points Term Structure Year Rate Rate 3 points 1 19 Year 20 O to 1 21 1 to 2 22 2 to 3 23 3 to 4 24 4 to 5 25 5 to 6 2 3 Insert your graph here 5% 5% 4% 4% 4% 4% 4 5 6 30 6b) Refer to the previous problem. Assume that instead of the expectations theory, the liquidity premium theory takes place. 31 32 For this question assume that the following liquidity premiums are expected: 096; 0.25%, 0.5%, 0.75%, 1%, and 1.25% respectively. 33 34 Plot the graph of Expectations and Liquidity preference over the years. Total points 8 35 36 Rate Year 37 Year 38 0 to 1 39 1 to 2 40 2 to 3 4% 4% 5% 6% 6%) 6% Liquidity Liquidity Expectation Premium Preference 1 0% 2 2 0.25% 3 0.50%) 4 1% 5 1.00% 61 1.25% Insert your graph here 41 3 to 4 42 4 to 5 43 5 to 6 44 45 46 47 3 points 3 points 48 49 50 51 2 points
Step by Step Solution
There are 3 Steps involved in it

Get step-by-step solutions from verified subject matter experts