

Question: 1. A cart is rolling down the ramp as shown in Figure 1. Assuming constant acceleration, draw the position-time, velocity-time, and acceleration-time graphs for the
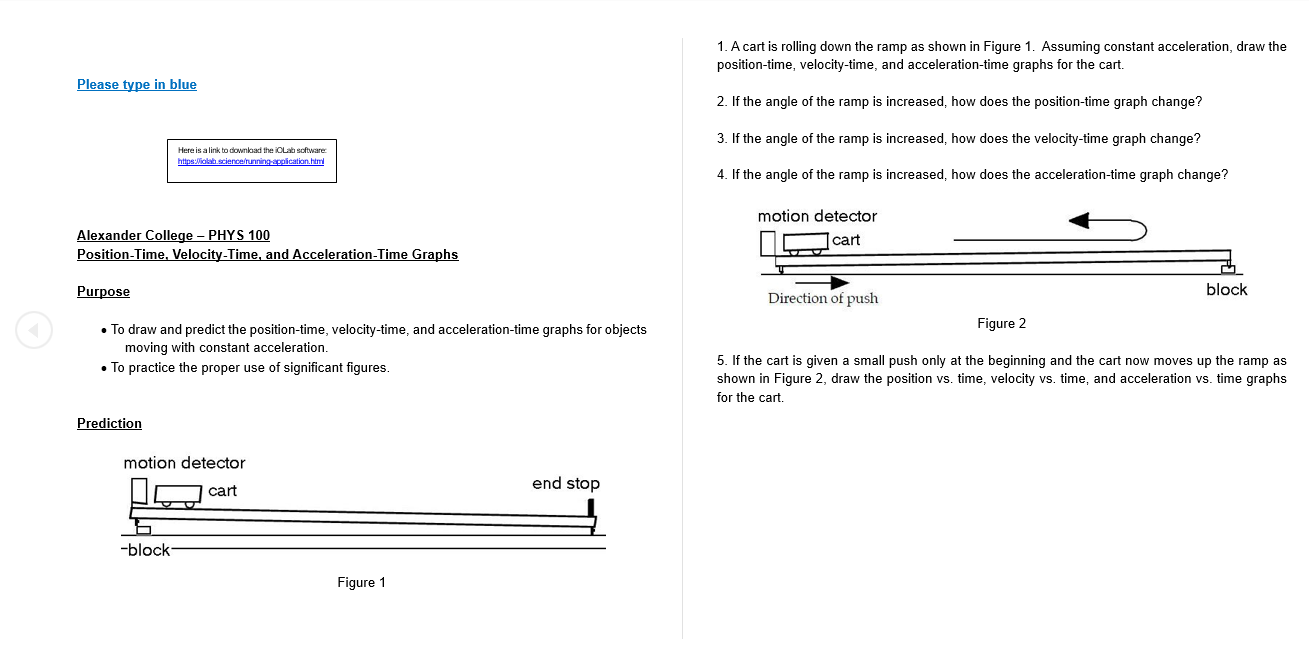
1. A cart is rolling down the ramp as shown in Figure 1. Assuming constant acceleration, draw the position-time, velocity-time, and acceleration-time graphs for the cart. Please type in blue 2. If the angle of the ramp is increased, how does the position-time graph change? 3. If the angle of the ramp is increased, how does the velocity-time graph change? Here is a link to download the iOLab software. https:Wolat science/running application.html 4. If the angle of the ramp is increased, how does the acceleration-time graph change? motion detector Alexander College - PHYS 100 Position-Time. Velocity-Time, and Acceleration-Time Graphs cart Purpose block Direction of push . To draw and predict the position-time, velocity-time, and acceleration-time graphs for objects Figure 2 moving with constant acceleration. . To practice the proper use of significant figures. 5. If the cart is given a small push only at the beginning and the cart now moves up the ramp as shown in Figure 2, draw the position vs. time, velocity vs. time, and acceleration vs. time graphs for the cart. Prediction motion detector cart end stop -block Figure 1
Step by Step Solution
There are 3 Steps involved in it

Get step-by-step solutions from verified subject matter experts