

Question: 1. A company records reported below indicate monthly sales data for Rasihaba company: Sales Month (000, units) October 2 November 2 December 4 January

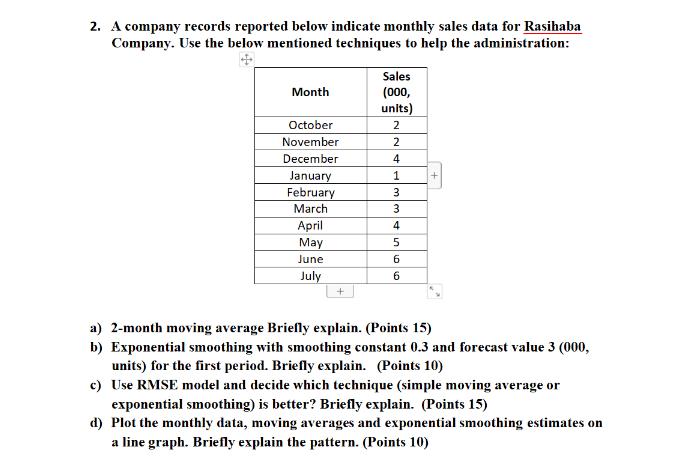
1. A company records reported below indicate monthly sales data for Rasihaba company: Sales Month (000, units) October 2 November 2 December 4 January 1 February 3 March 3 April 4 May 5 June 6 July 6 a) Use linear trend model to forecast next 2 months. Briefly explain. (Points 15) b) Determine the correlation coefficient, coefficient determination and standard deviation. Briefly explain. (Points 20) c) Plot the actual and forecasted values on a line graph. Briefly explain. (Points 15) 2. A company records reported below indicate monthly sales data for Rasihaba Company. Use the below mentioned techniques to help the administration: Sales Month (000, units) October 2 November 2 December 4 January February 1 + 3 March 3 April 4 May June 5 6 July 6 + a) 2-month moving average Briefly explain. (Points 15) b) Exponential smoothing with smoothing constant 0.3 and forecast value 3 (000, units) for the first period. Briefly explain. (Points 10) c) Use RMSE model and decide which technique (simple moving average or exponential smoothing) is better? Briefly explain. (Points 15) d) Plot the monthly data, moving averages and exponential smoothing estimates on a line graph. Briefly explain the pattern. (Points 10)
Step by Step Solution
There are 3 Steps involved in it

Get step-by-step solutions from verified subject matter experts