

Question: 1. A comparative income statement is given below for McKenzie Sales, Limited, of Toronto: McKenzie Sales, Limited Comparative Income Statement This Year Last Year Sales
1.
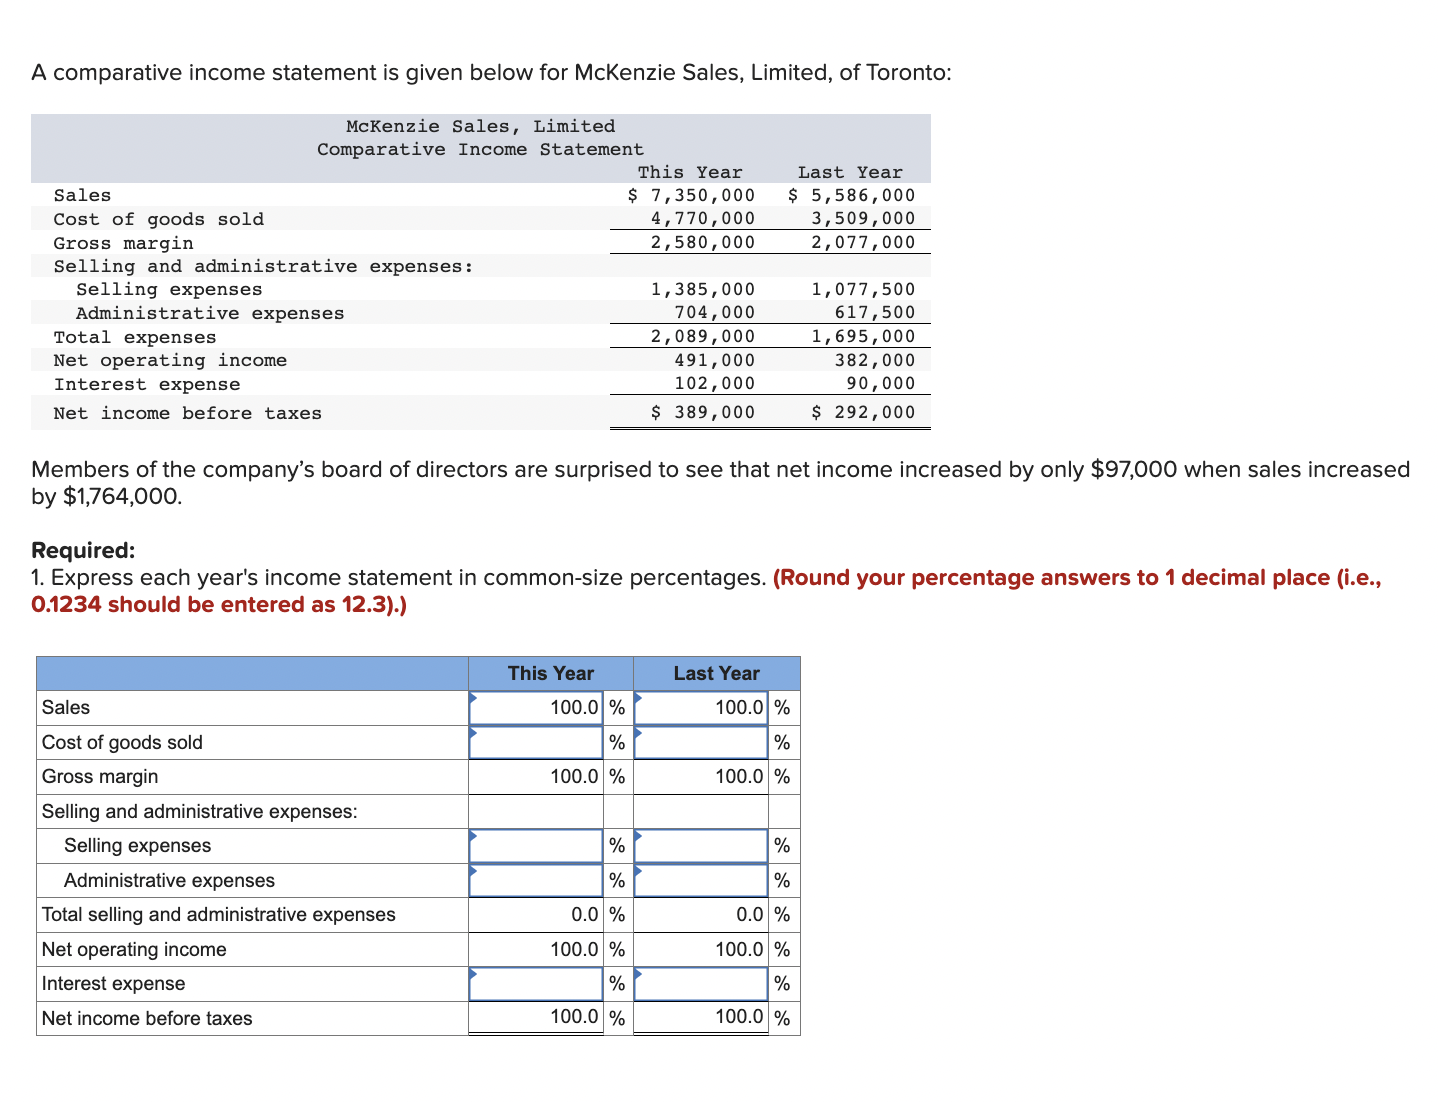
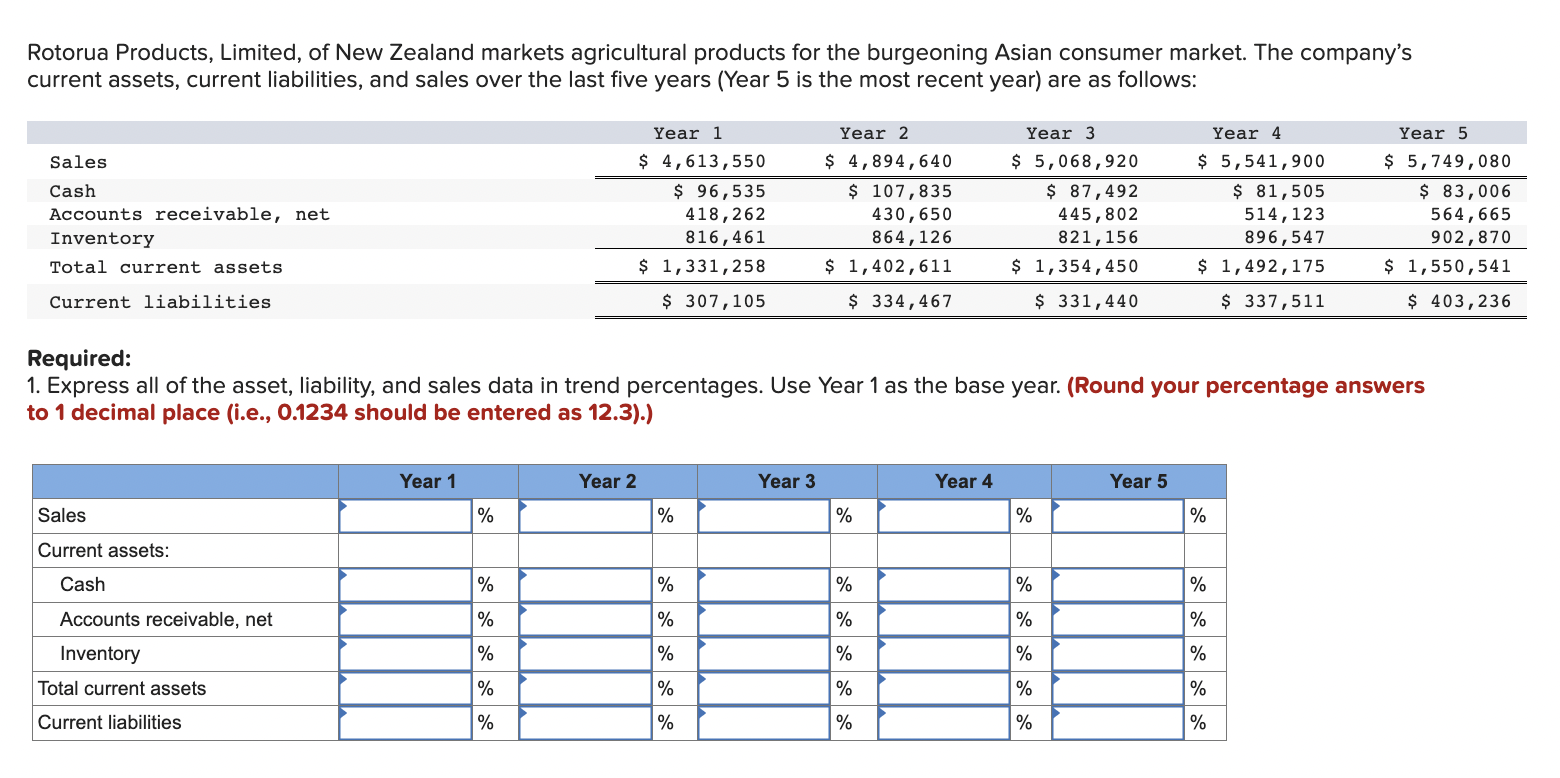
A comparative income statement is given below for McKenzie Sales, Limited, of Toronto: McKenzie Sales, Limited Comparative Income Statement This Year Last Year Sales 5 7,350,000 $ 5,586,000 Cost of goods sold 4,770,000 3,509,000 Gross margin 2,580,000 2,077,000 Selling and administrative expenses: Selling expenses 1,385,000 1,077,500 Administrative expenses 704,000 617,500 Total expenses 2,089,000 1,695,000 Net operating income 491,000 382,000 Interest expense 102,000 90,000 Net income before taxes $ 389,000 5 292,000 Members of the company's board of directors are surprised to see that net income increased by only $97,000 when sales increased by $1,764,000. Required: 1. Express each year's income statement in common-size percentages. (Round your percentage answers to 1 decimal place (i.e., 0.1234 should be entered as 12.3).) Sales Cost of goods sold Gross margin Selling and administrative expenses: Selling expenses Administrative expenses Total selling and administrative expenses 0.0 % 0.0 % Net operating income 100.0 "/0 100.0 \"/1: Net income before taxes 100.0 % 100.0 % Rotorua Products, Limited, of New Zealand markets agricultural products for the burgeoning Asian consumer market. The company's current assets, current liabilities, and sales over the last five years (Year 5 is the most recent year) are as follows: Year 1 Year 2 Year 3 Year 4- Year 5 Sales 5 4,613,550 $ 4,894,640 $ 5,068,920 5 5,541,900 $ 5,749,080 Cash 5; 96,535 S 107,835 $ 87,492 $ 81,505 $ 83,006 Accounts receivable, net 418,262 430,650 445,802 514,123 564,665 Inventory 816,461 864,126 821,156 896,547 902,870 Total current assets 5 1,331,258 $ 1,402,611 $ 1,354,450 $ 1,492,175 $ 1,550,541 Current liabilities $ 307,105 S 334,467 5 331,440 $ 337,511 $ 403,236 Required: 1. Express all of the asset. liability, and sales data in trend percentages. Use Year 1 as the base year. (Round your percentage answers to 1 decimal place (i.e.. 0.1234 should be entered as 12.3).) Current assets: Accounts receivable, nel Inventory Tolal current assets Current liabilities
Step by Step Solution
There are 3 Steps involved in it

Get step-by-step solutions from verified subject matter experts