

Question: 1. {a} Explain the dierence between a parameter and a statistic. {b} When dealing with means. what is the parameter symbol used? What is the
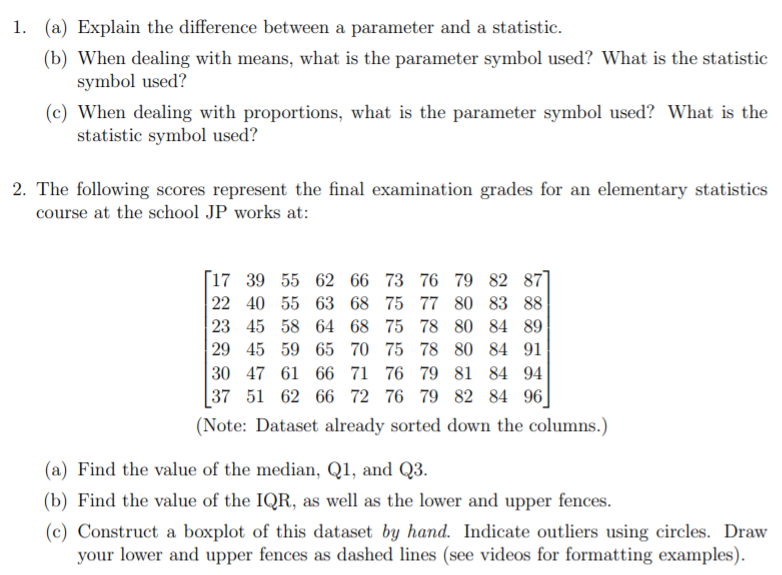
1. {a} Explain the dierence between a parameter and a statistic. {b} When dealing with means. what is the parameter symbol used? What is the statistic symbol used? {c} When dealing with proportions, what is the parameter symbol used? What is the statistic symbol used? 2. The following scores represent the nal examination grades for an elementary statistics course at the school JP works at: 17 39 22 4D 23 45 29 45 30 47 37 51 55 55 53 59 61 I52 assess 65 63 63 79 71 72 73 76 75 77 75 73 75 73 76 79 76 79 sees 31 32 32 37 33 33 34 39 34 91 34 94 34 95 (Note: Dataset already sorted down the columns.) {a} Find the value of the median, Q1, and Q3. (5} Find the value of the IQR, as well as the lower and upper fences. (c) Construct a boxplot of this dataset by hand. Indicate outliers using circles. Draw your lower and upper fences as dashed lines (see videos for formatting examples)
Step by Step Solution
There are 3 Steps involved in it

Get step-by-step solutions from verified subject matter experts