

Question: 1. A function f[r,y} is given to you as a contour diagram on the region R = [21 2] x [2, 2]: -2 -1.5 -1
![diagram on the region R = [21 2] x [2, 2]: -2](https://s3.amazonaws.com/si.experts.images/answers/2024/06/6666a79b4b09d_6116666a79b2746e.jpg)
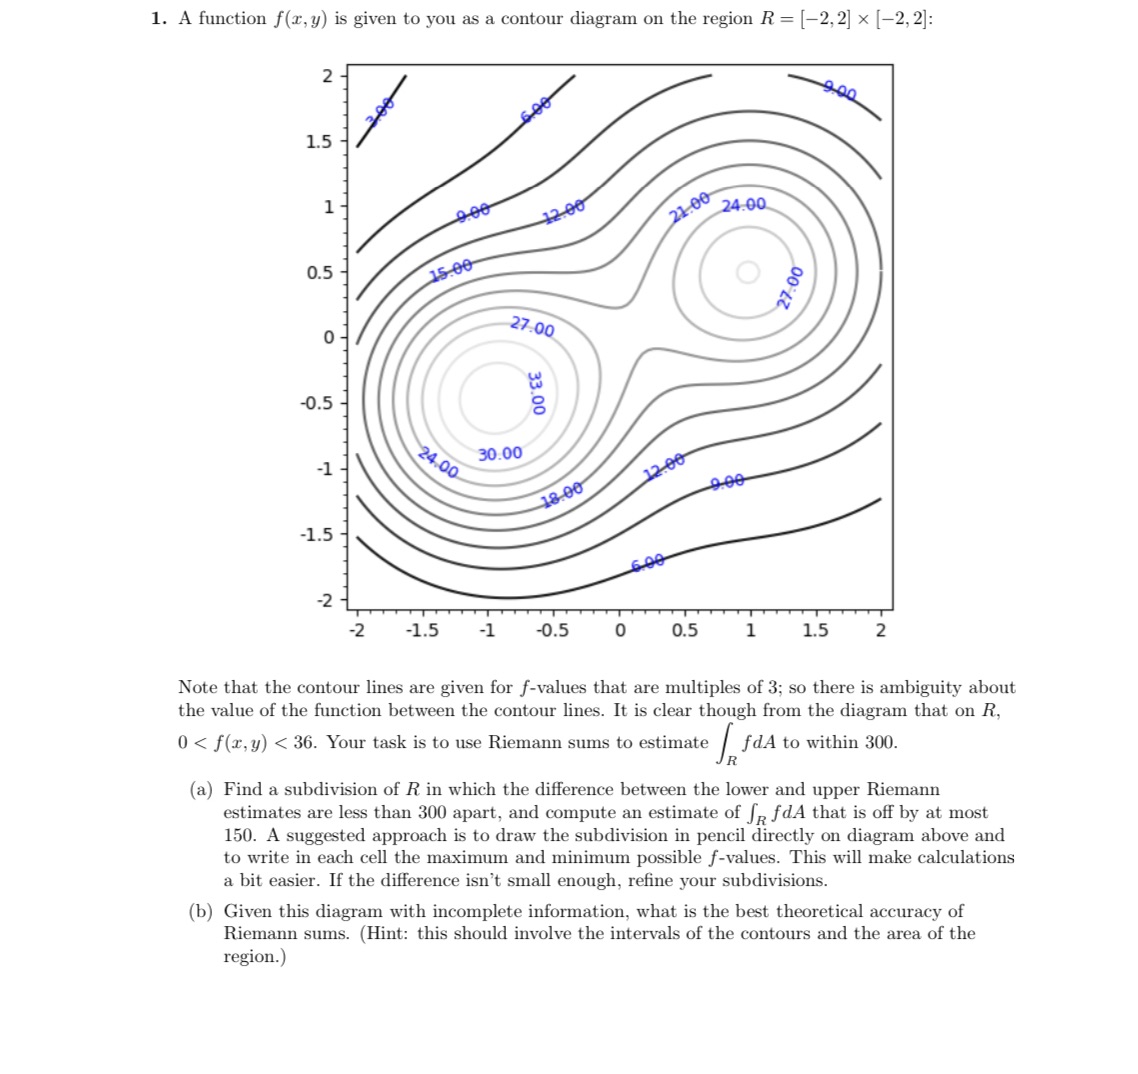
1. A function f[r,y} is given to you as a contour diagram on the region R = [21 2] x [2, 2]: -2 -1.5 -1 -0.5 0 0.5 1 1.5 2 Note that the contour lines are given for fvalues that are multiples of 3; so there is ambiguity about the value of the function between the contour lines. It is clear though from the diagram that on R, 0
Step by Step Solution
There are 3 Steps involved in it
1 Expert Approved Answer
Step: 1 Unlock

Question Has Been Solved by an Expert!
Get step-by-step solutions from verified subject matter experts
Step: 2 Unlock
Step: 3 Unlock