

Question: 1. A Math 107 class had an activity to look at resting pulse rates. Data was collected by randomly selecting 16 males and 17 females:
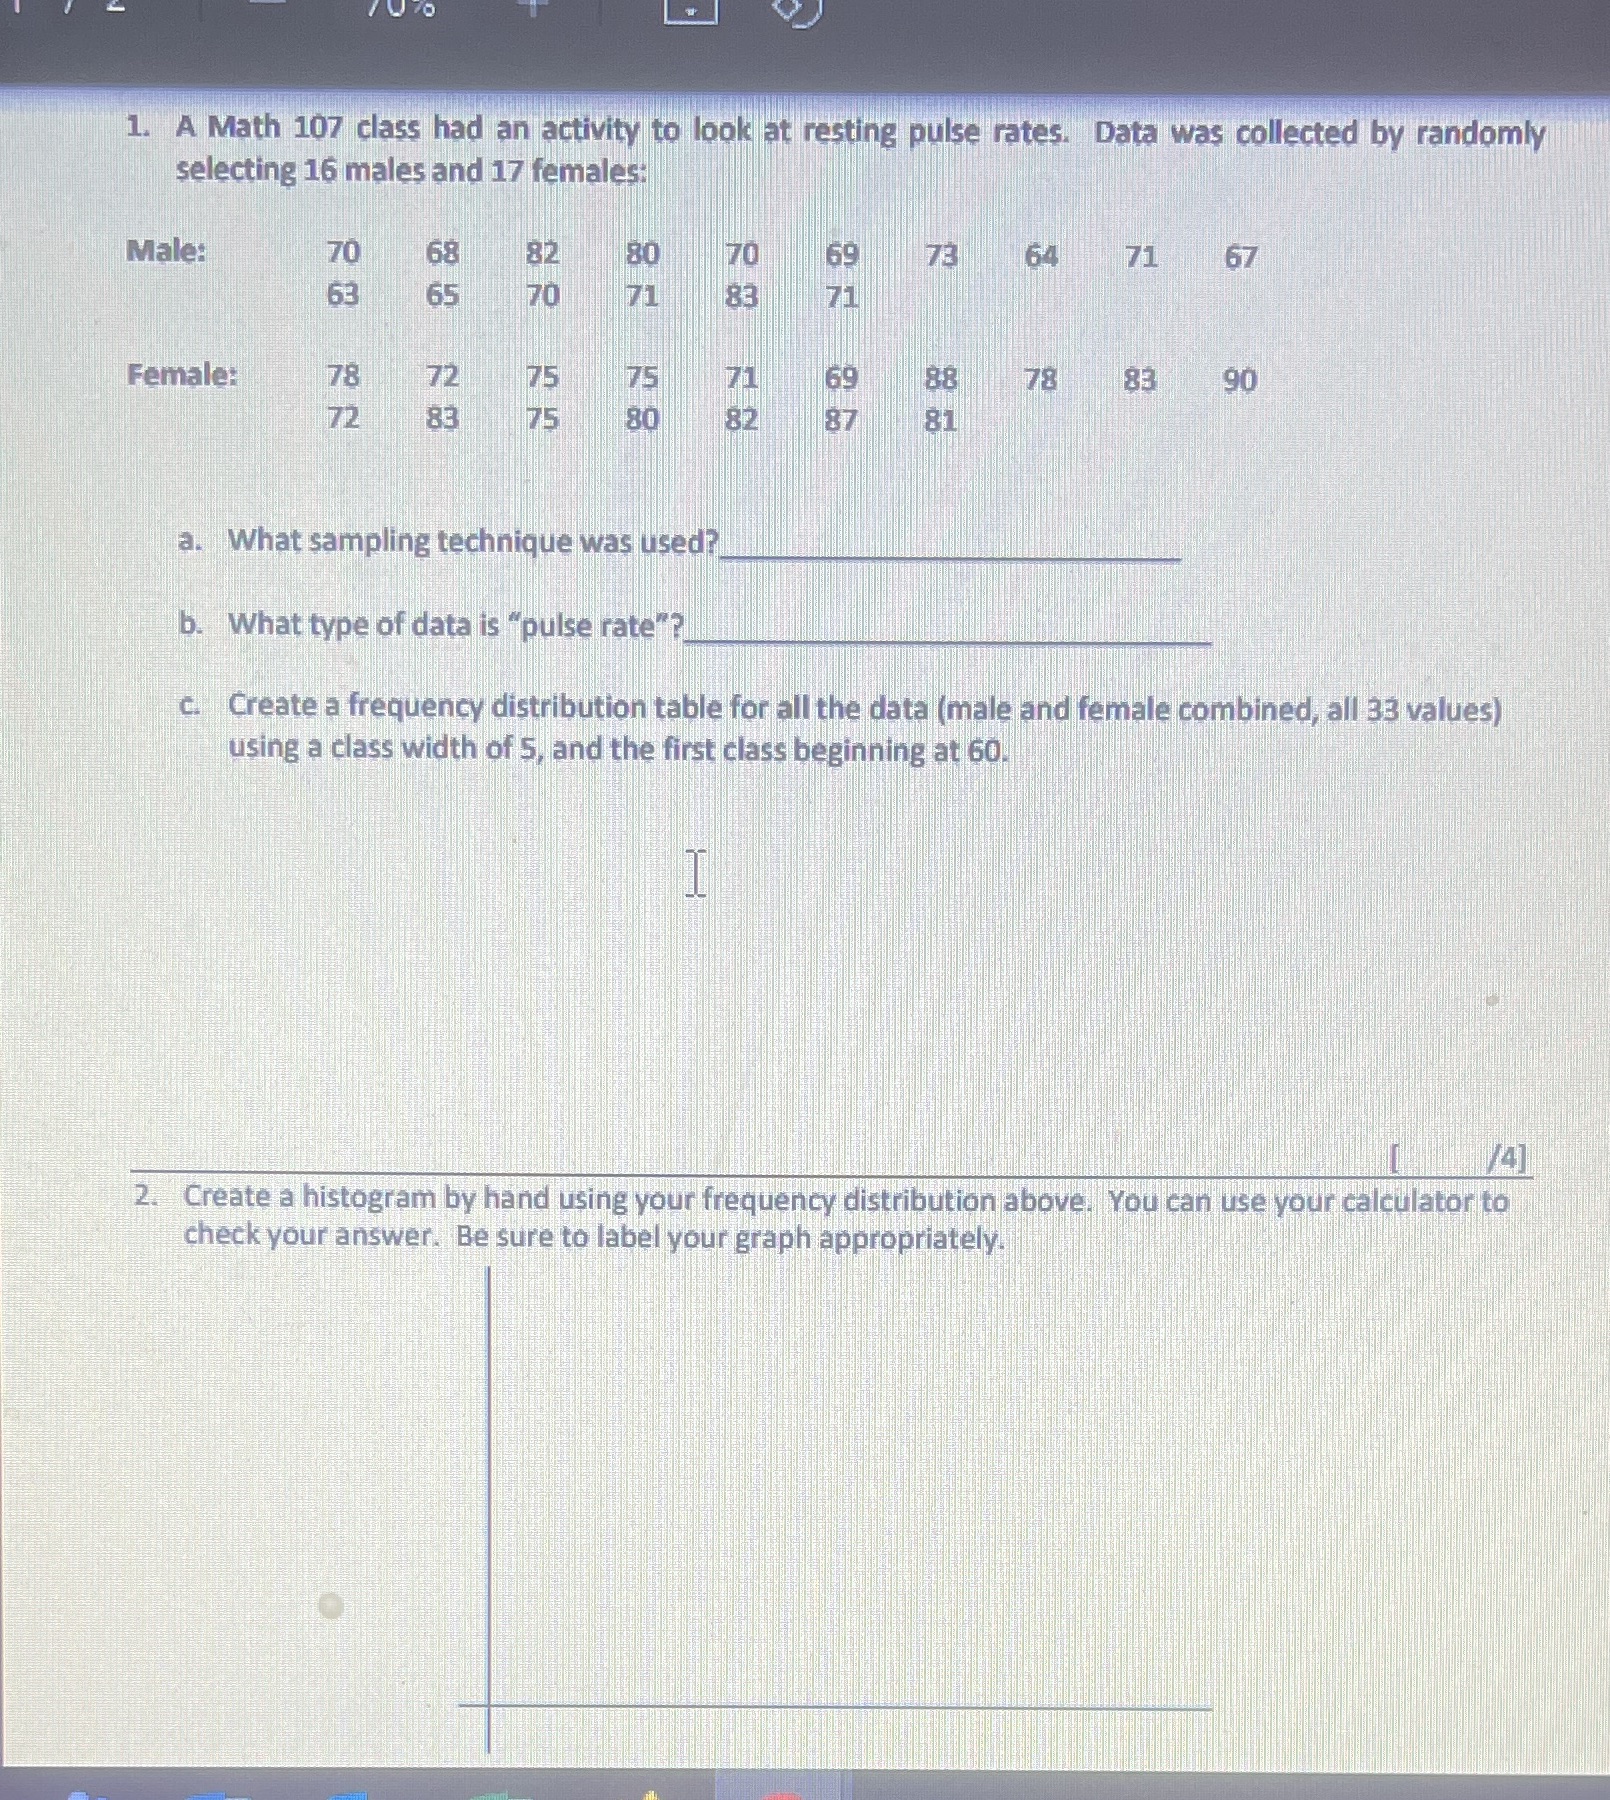
1. A Math 107 class had an activity to look at resting pulse rates. Data was collected by randomly selecting 16 males and 17 females: Male: 70 68 82 30 70 69 73 64 71 67 63 65 70 83 71 Female: 78 72 75 75 71 69 88 78 83 90 72 83 75 80 82 87 81 a. What sampling technique was used? b. What type of data is "pulse rate"? c. Create a frequency distribution table for all the data (male and female combined, all 33 values) using a class width of 5, and the first class beginning at 60. /4] 2. Create a histogram by hand using your frequency distribution above. You can use your calculator to check your answer. Be sure to label your graph appropriately
Step by Step Solution
There are 3 Steps involved in it

Get step-by-step solutions from verified subject matter experts