

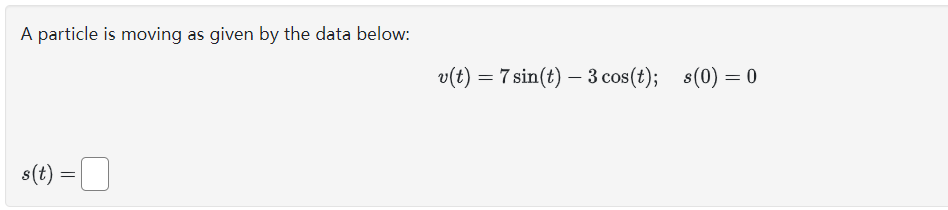
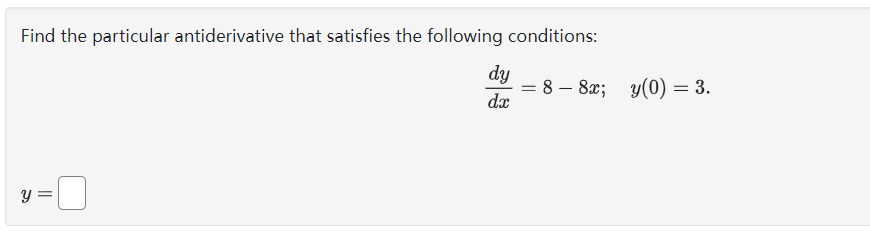
Question: 1. A particle is moving as given by the data below: v(t) = 7 sin(t) - 3 cos(t); s(0) = 0 s (t) =f$2 a)


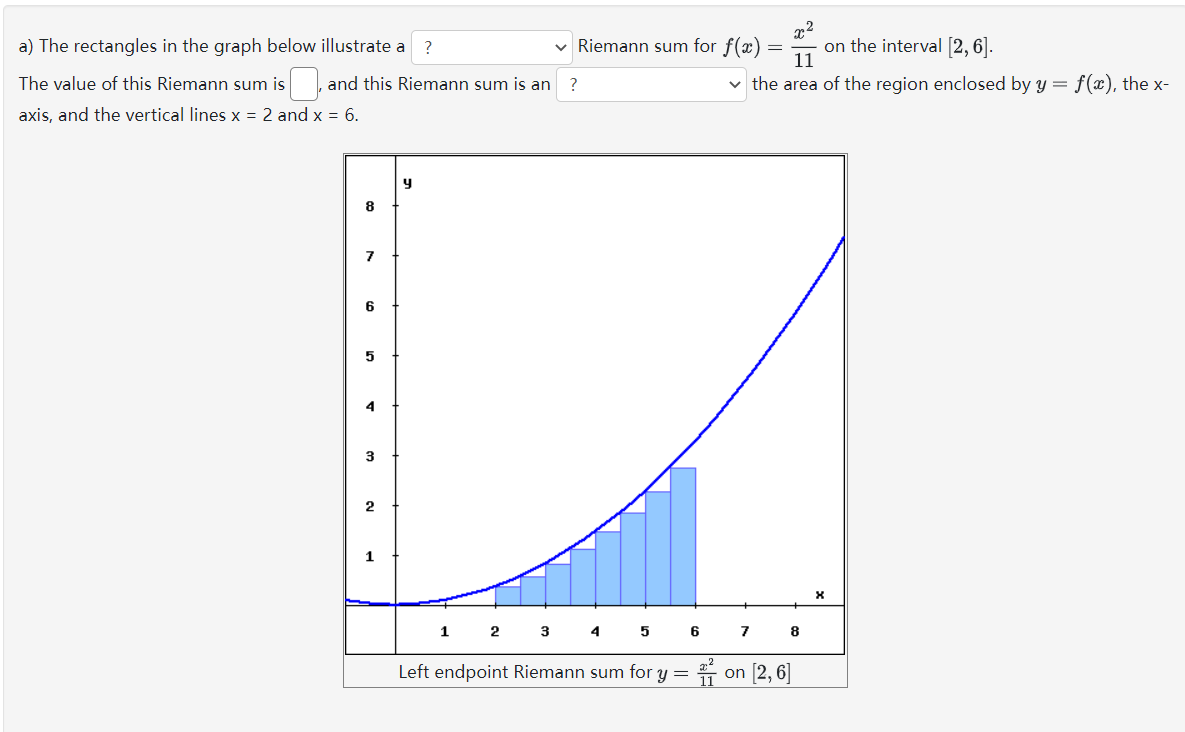
![Riemann sum for x) 2 H on the interval [2, 6]. The](https://s3.amazonaws.com/si.experts.images/answers/2024/06/6665a81309ba0_1946665a812ef6d8.jpg)
![value of this Riemann sum is C] and this Riemann sum is](https://s3.amazonaws.com/si.experts.images/answers/2024/06/6665a813402b9_1956665a813306ba.jpg)

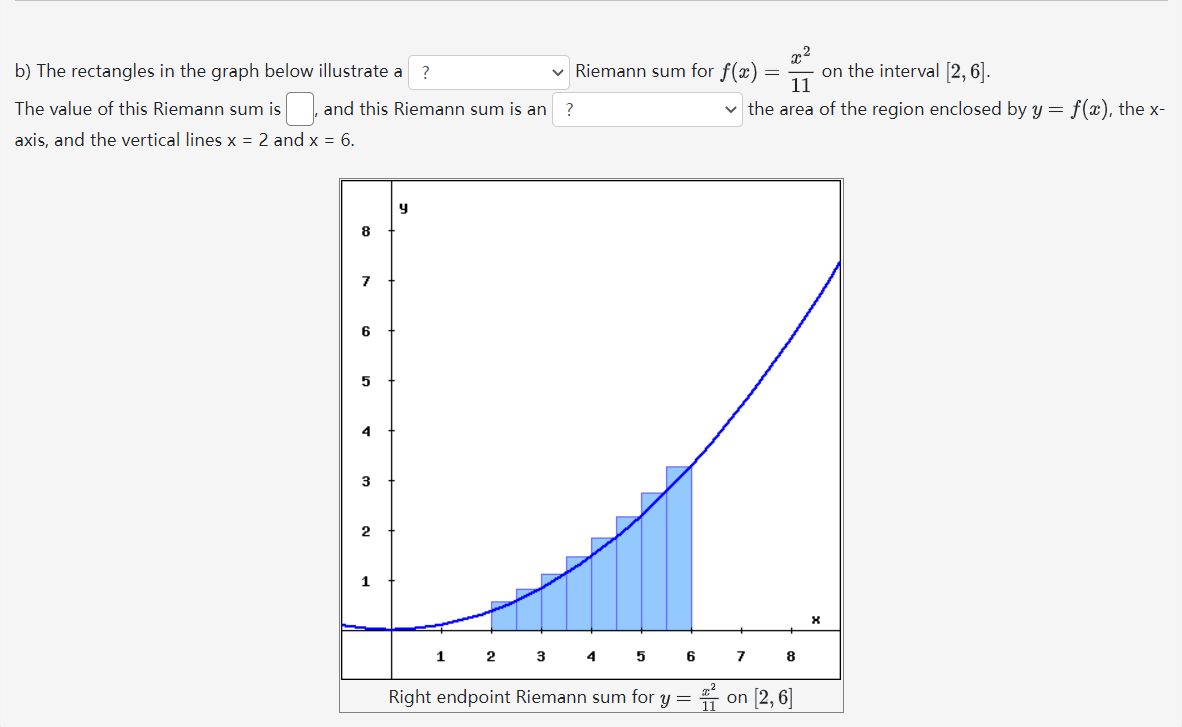
![[2, 6] b) The rectangles in the graph below illustrate a The](https://s3.amazonaws.com/si.experts.images/answers/2024/06/6665a8143dc42_1966665a8142b8a3.jpg)
1.
![and this Riemann sum is an 11 on the interval [2, 6].](https://s3.amazonaws.com/si.experts.images/answers/2024/06/6665a814d5791_1966665a814b9dff.jpg)
![8 Right endpoint Riemann sum for y = #, on [2, 6]a)](https://s3.amazonaws.com/si.experts.images/answers/2024/06/6665a81628b35_1986665a81618b06.jpg)

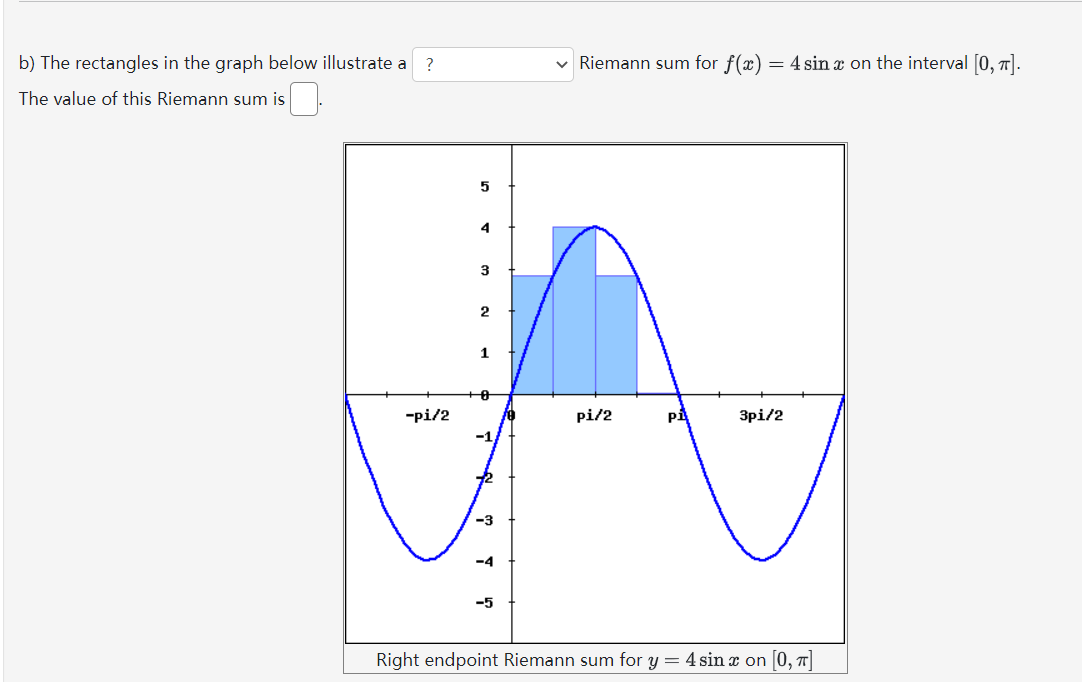
![f(x) = 4 sin x on the interval [0, 7]. The value](https://s3.amazonaws.com/si.experts.images/answers/2024/06/6665a816c764c_1986665a816b7e26.jpg)

![[0, 7]b) The rectangles in the graph below illustrate a ? Riemann](https://s3.amazonaws.com/si.experts.images/answers/2024/06/6665a817b9e94_1996665a817a8fca.jpg)
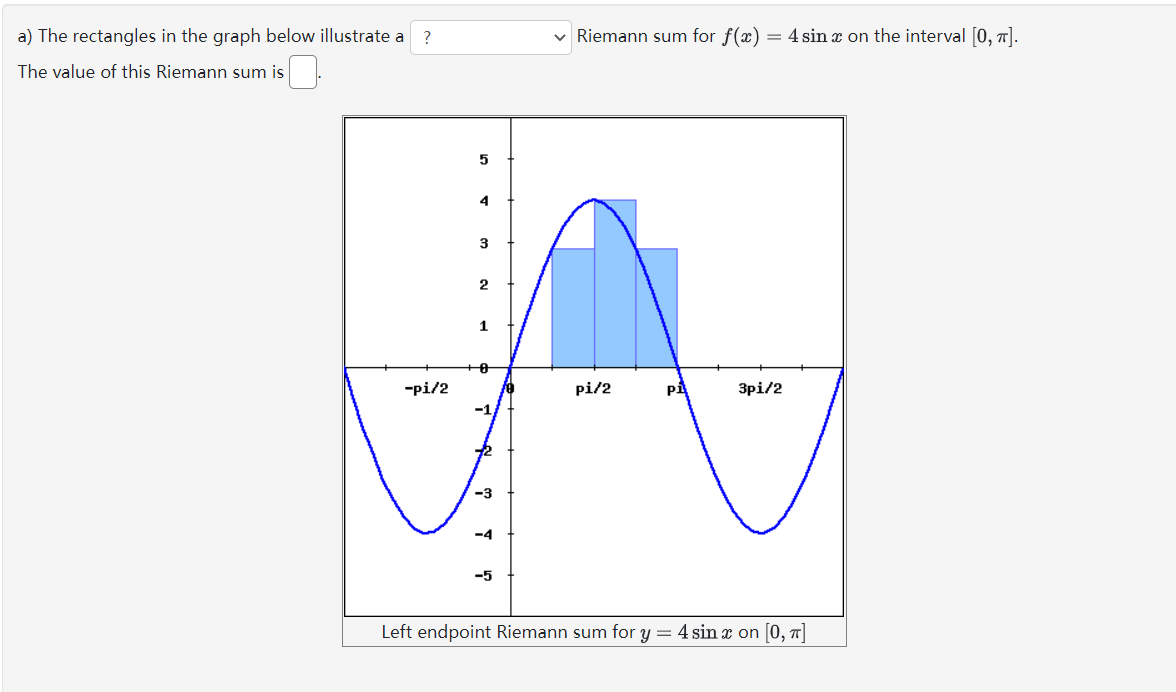
A particle is moving as given by the data below: v(t) = 7 sin(t) - 3 cos(t); s(0) = 0 s (t) =\f$2 a) The rectangles in the graph below illustrate a ? v Riemann sum for x) 2 H on the interval [2, 6]. The value of this Riemann sum is C] and this Riemann sum is an ? v the area of the region enclosed by y = f(m) the x axis, and the vertical lines x = 2 and x = 6. Left endpoint Riemann sum for y = fi on [2, 6] b) The rectangles in the graph below illustrate a The value of this Riemann sum is. v Riemann sum for f(a) = and this Riemann sum is an 11 on the interval [2, 6]. axis, and the vertical lines x = 2 and x = 6. ? the area of the region enclosed by y = f(x), the x- y 8 6 5 3 2 1 3 5 6 7 8 Right endpoint Riemann sum for y = #, on [2, 6]a) The rectangles in the graph below illustrate a ? Riemann sum for f(x) = 4 sin x on the interval [0, 7]. The value of this Riemann sum is A -pi/2 pi/2 3pi/2 -1 -3 -4 -5 Left endpoint Riemann sum for y = 4 sin x on [0, 7]b) The rectangles in the graph below illustrate a ? Riemann sum for f(x) = 4 sina on the interval [0, 7]. The value of this Riemann sum is A 1 0 -pi/2 pi/2 3pi/2 -1 -3 -4 -5 Right endpoint Riemann sum for y = 4 sin x on [0, 7]
Step by Step Solution
There are 3 Steps involved in it

Get step-by-step solutions from verified subject matter experts