

Question: 1) A Pew Research study conducted in 2017 found that approximately 75% of Americans believe that robots and computers might one day do many of
1)
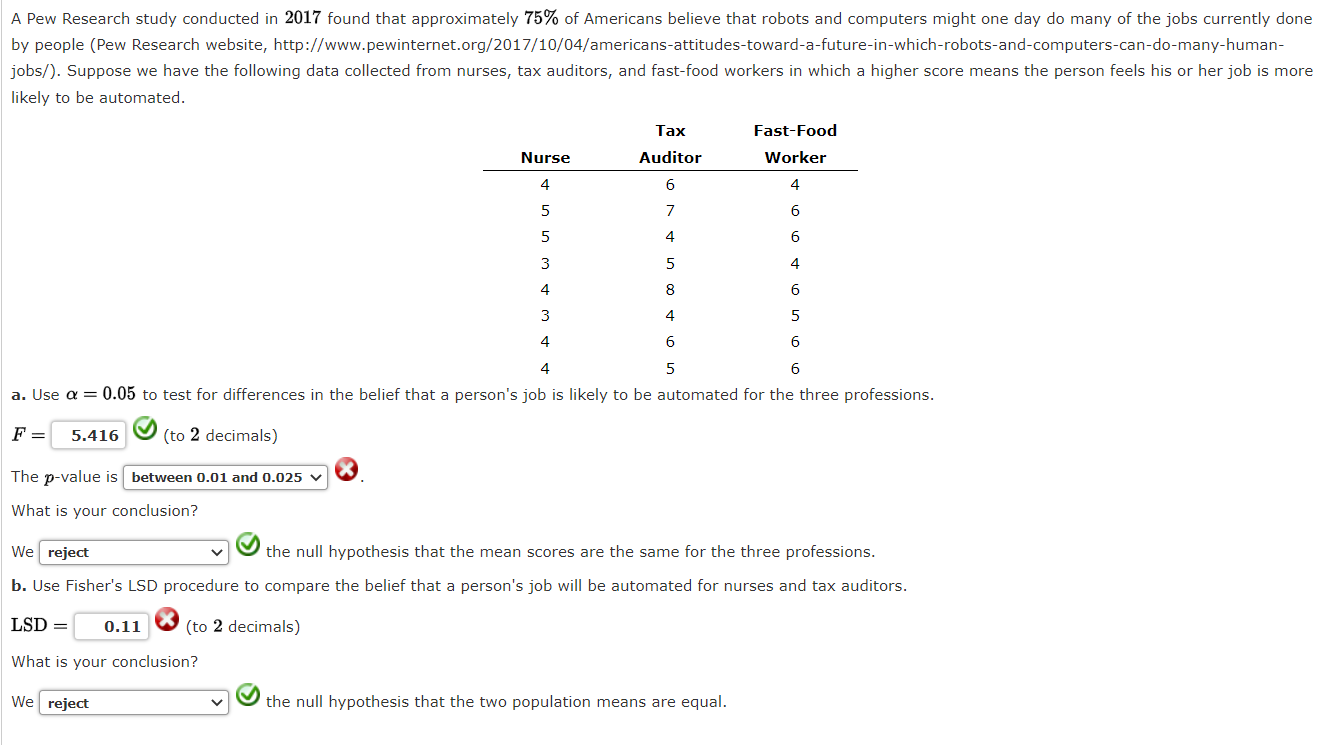
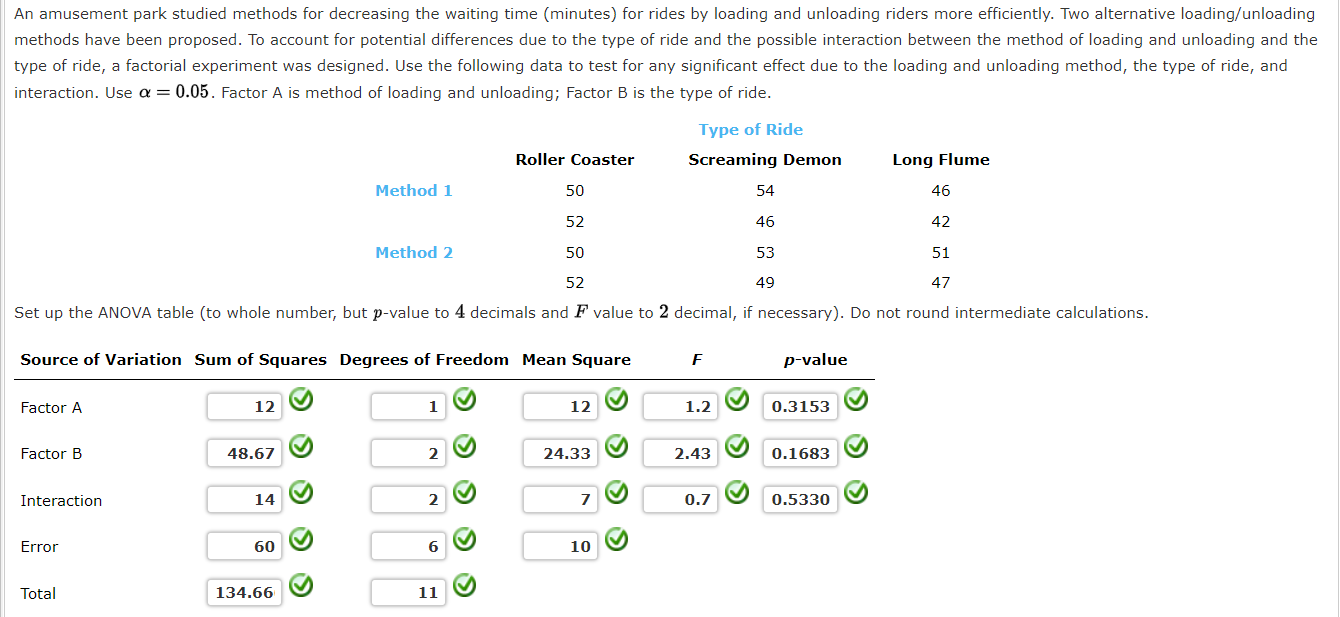
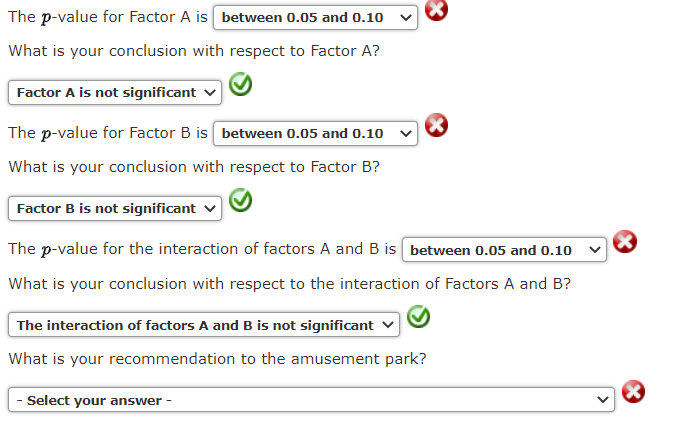
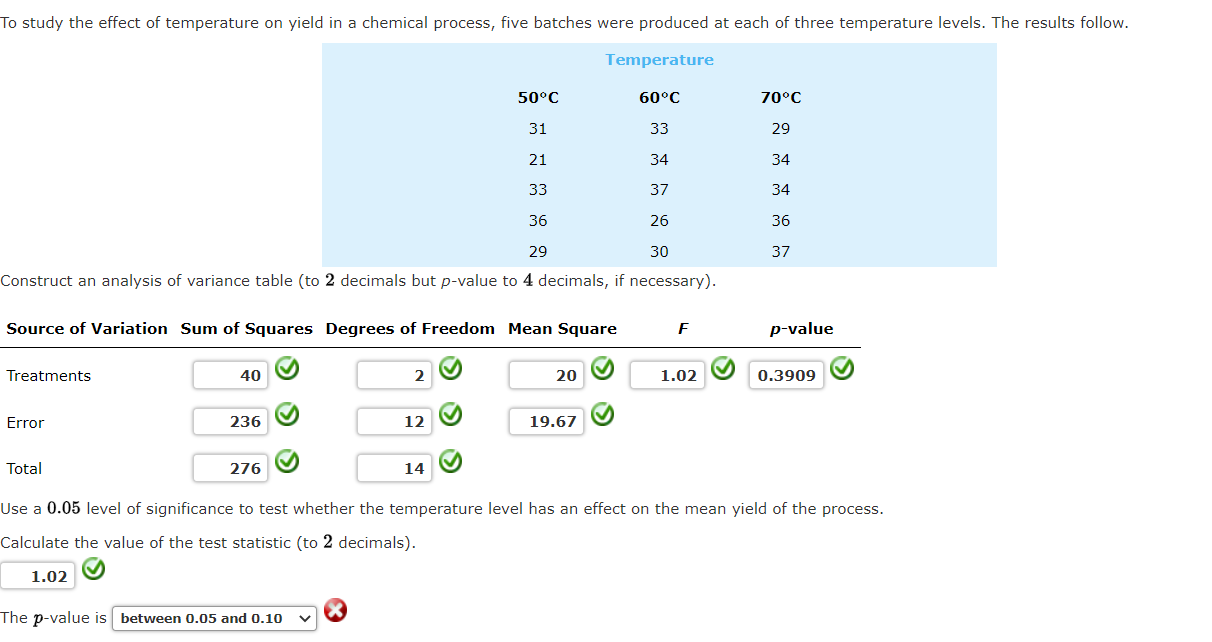
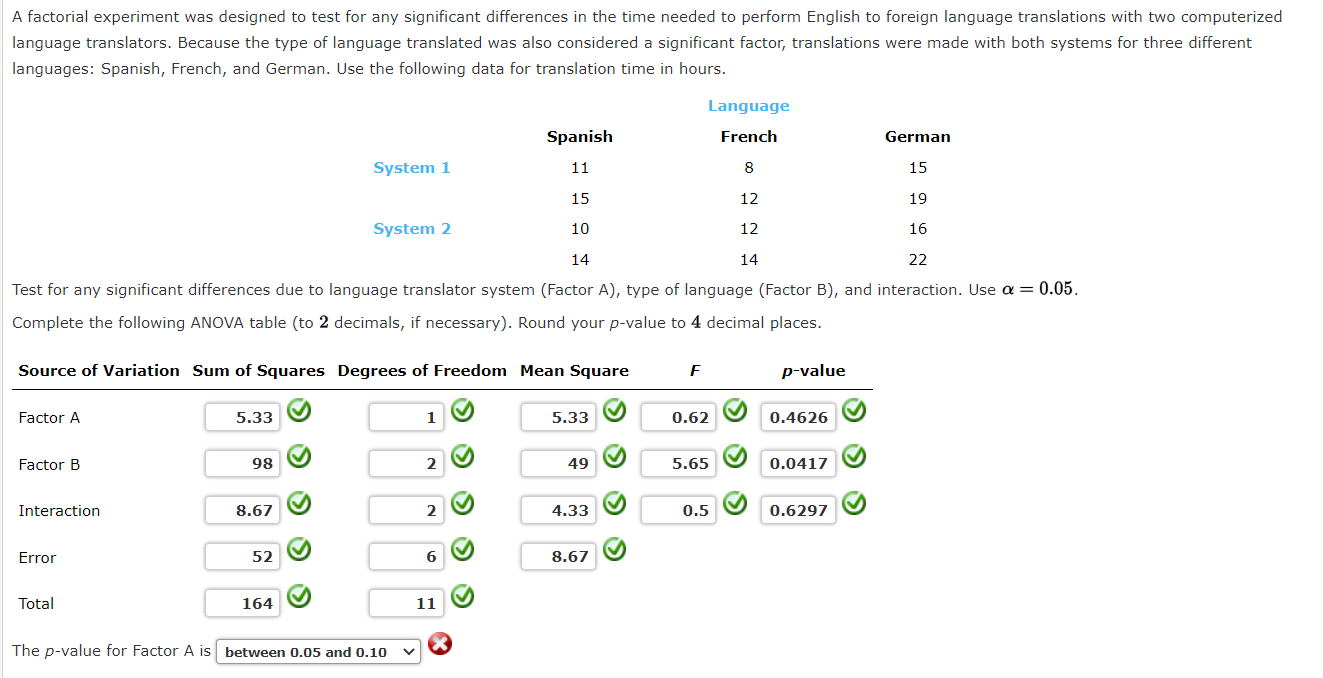
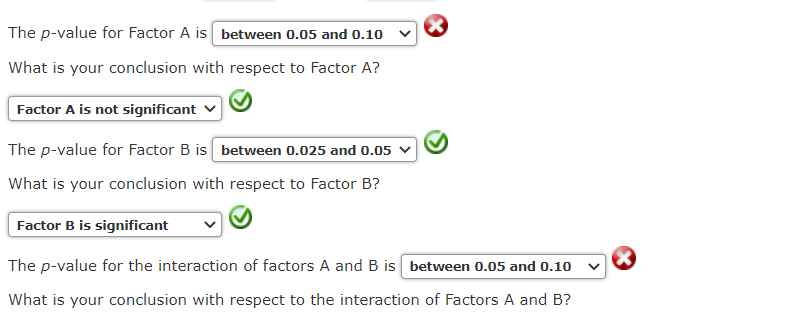
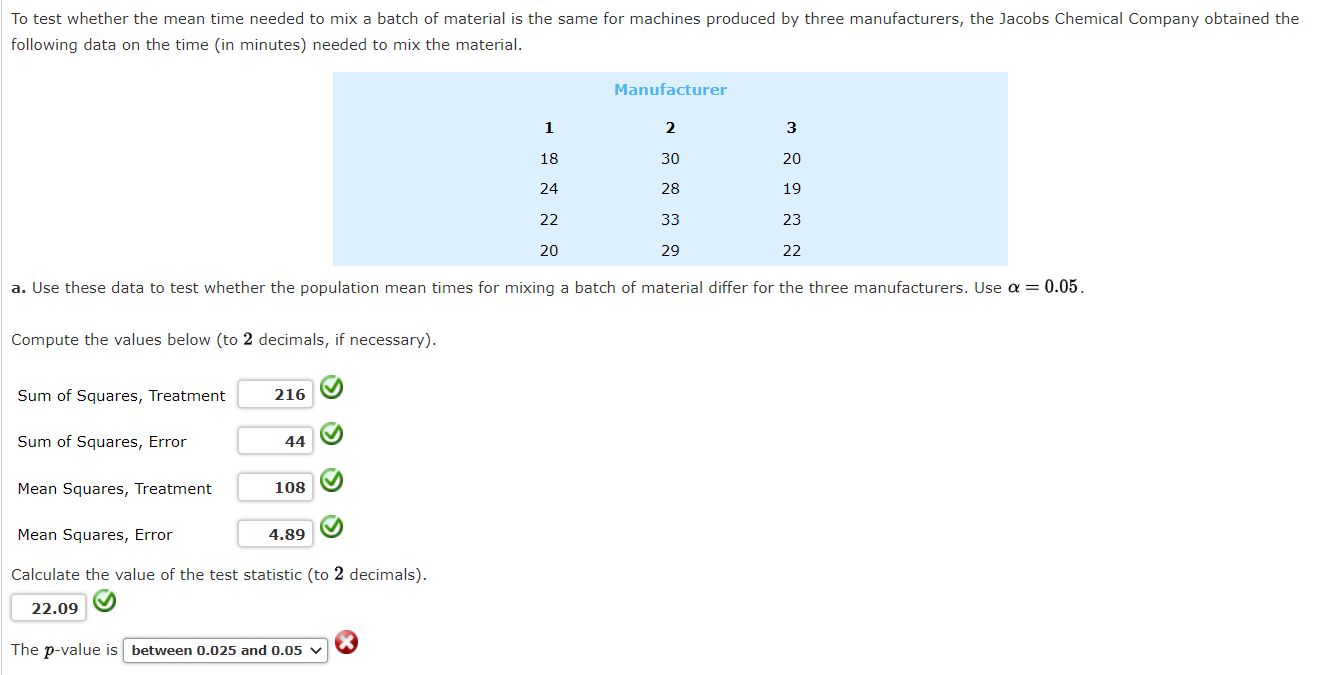
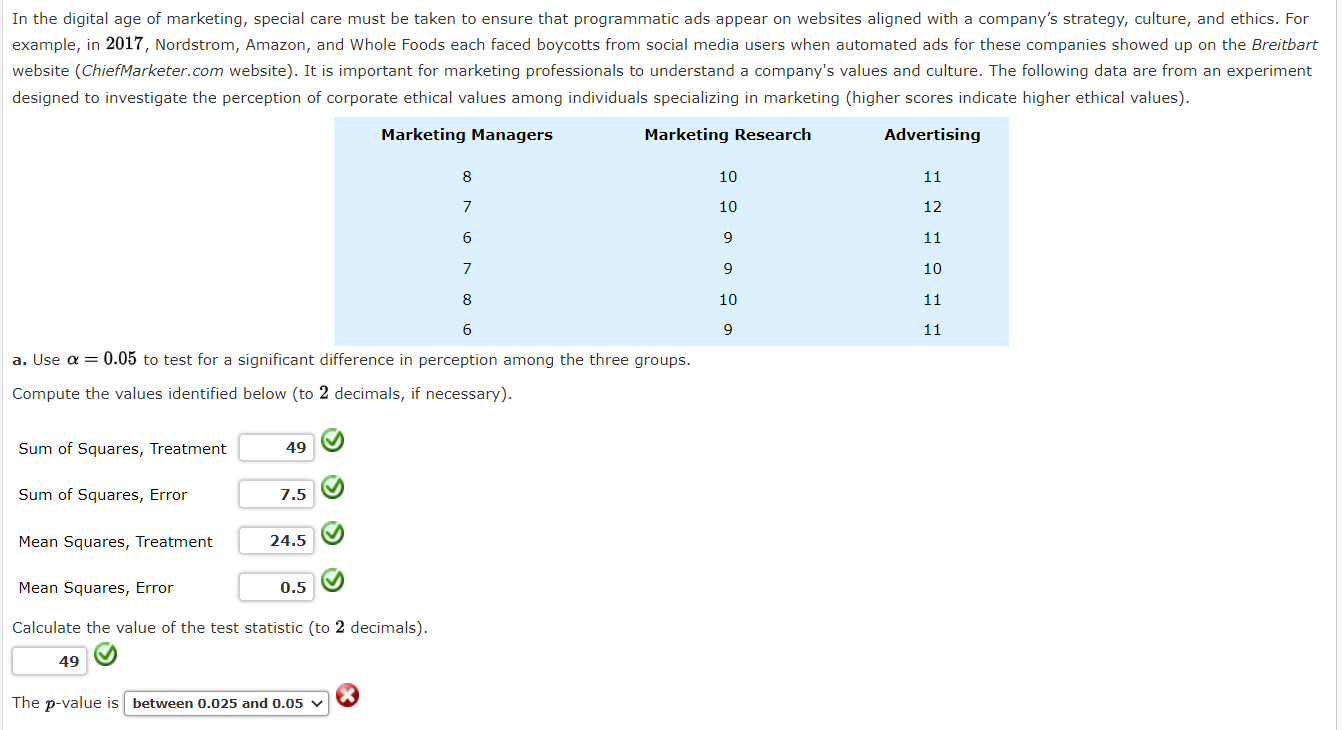
A Pew Research study conducted in 2017 found that approximately 75% of Americans believe that robots and computers might one day do many of the Jobs currently done by peopie (Pew Research webSite, http:f/wwwpewintemetorg/ZD17/1D/O4Jamericansrattitudesrtowardraefuturerinewhicherobotseandrcomputersecanedormanyrhumahe jobs/). Suppose we have the following data collected from nurses, tax auditors, and fastfood workers in which a higher score means the person feels his or her job is more likely to be automated. Tax Fa st- Food Nurse Auditor Worker 4 6 4 5 7 6 5 4 6 3 5 4 4 8 6 3 4 5 4 6 6 4 5 6 a. Use a = 0.05 to test for differences In the belief that a person's job is likely to be automated for the three professions. F = 5.416 M (to 2 demmais) The prvalue is between D.I]1 and 0.025 v 0. What is your concluSion? We M the null hypothesis that the mean scores are the same for the three professions. b. Use Fisher's LSD procedure to compare the belief that a person's job will be automated for nurses and tax auditors. LSD = 0.11 0 (to 2 decimals) What is your concluSion? We '20 the null hypothesis that the two population means are equal. An amusement park studied methods for decreasing the waiting time (minutes) for rides by loading and unloading riders more effiCiently. Two alternative loading/unloading methods have been proposed. To account for potential differences due to the type of ride and the possible interaction between the method of loading and unloading and the type of ride, a factorial experiment was designed. Use the following data to test for any signicant effect due to the loading and unloading method, the type of ride, and interaction. Use a = 0.05. Factor A is method of loading and unloading; Factor Bis the type of ride. Set up the ANOVA table (to whole number, but pevalue to 4 decimals and F value to 2 decimal, if necessary). Do not round intermediate calculations. Roller Coaster Type of Ricle Screaming Demon Long Flume Method 1 50 54 46 52 46 42 Method 2 50 53 51 52 49 47 Source of Variation Sum of Squares Degrees of Freedom Mean Square F p-value Factor A Factor B Interaction Error Total 12 48.67 14 60 134.66 Q 6' G,- G.' g. 160 1269 269 24.339 29 760 69 109 u 1.2 K20 0.3153 Q9 2.43 K20 0.1683 Q0 0.7 U 0.5330 M The pValue for Factor A is (3 What is your conclusion with respect to Factor A? l Factor A is not signicant v] M The pValue for Factor B is 0 What is your conclusion with respect to Factor B? l Factor B is not signicant v] M The pValue for the interaction of factors A and B is 0 What is your conclusion with respect to the interaction of Factors A and B? | The interaction of factors A and Bis not signicant V] M What is your recommendation to the amusement park? Select your answer - V 0 To study the effect of temperature on yield in a chemical process, five batches were produced at each of three temperature levels. The results follow. 50C 60C 70C 31 33 29 21 34 34 33 37' 34 36 26 35 29 30 37 Construct an analysis of variance table {to 2 decimals but p-value to 4 decimals, if necessary). Source of Variation Sum of Squares Degrees of Freedom Mean Square F p-value Treatments 40 \\'0 2 \\'19 20 \\'0 1.02 M 0.3909 \\'0 Error 236 to 12 \\'D 19.67r Q0 Total 276 \\'0 14 \\'9 Use a 0.05 level of significance to test whether the temperature level has an effect on the mean yield of the process. Calculate the value of the test statistic (to 2 decimals). 1.02 w The pvalue is I between 0.05 and 0.10 V] a A factorial experiment was designed to test for anyr signicant differences in the time needed to perform English to forEign language translations with two computerized language translators. Because the type of language translated was also considered a signicant factor, translations were made with both systems for three different languages: Spanish, French, and German. Use the following data for translation time in hours. Language Spanish French German System 1 11 8 15 15 1.2 19 System 2 10 1.2 16 14 14 22 Test for any significant differences due to language translator system [Factor A), type of language {Factor B), and Interaction. Use a = 0.05. Complete the folloWing ANOVA table (to 2 decimals, if necessary). Round your pvalue to 4 decimal places. Source of Variation Sum of Squares Degrees of Freedom Mean Square F p-value FactorA 5.33 9 1 Q 5.33 9 0.62 9 0.4626 9 Factor B 98 9 2 49 Q 5.65 k'b 0.0417 0 Interaction 8.67 M 2 4.33 9 0.5 K'D 0.6297 9 Error 52 Q9 6 Q 8.67 Q Total 164 \\'9 11 60 The p-Value for Factor A isl between 0.05 and 0.10 VI 0 The pvalue for Factor A is| between I105 and 0.10 V| 0 What is your conclusion with respect to Factor A? Factor A is not signicant V w The p-value for Factor B is| between 0.025 and 0.05 V| M What is your conclusion with respect to Factor B? M The p-value for the interaction of factors A and B is 0 What is your conclusion with respect to the interaction of Factors A and B? To test whether the mean time needed to mix a batch of material is the same for machines produced by three manufacturers, the Jacobs Chemical Company obtained the Following data on the time (in minutes) needed to mix the material. Manufacturer 1 2 3 18 30 2O 24 28 19 22 33 23 2O 29 22 a. Use these data to test whether the population mean times for mixing a batch of material differ for the three manufacturers. Use a = 0.05. Compute the values below (to 2 deCImals, if necessary). Sum of Squares, Treatment 216 w Sum of Squares, Error 44 Q Mean Squares, Treatment 108 @ Mean Squares, Error 4.89 Calculate the value of the test statistic (to 2 deCImals}. 22.09 M Thepuevaws'D In the digital age of marketing, special care must be taken to ensure that programmatic ads appear on websites aligned with a company's strategy, culturer and ethics. For example, in 2017, Nordstrom, Amazon, and Whole Foods each faced boycotts from social media Llsers when automated ads for these companies showed up on the Breirbart webSite (ChiefMarketer.com webSite). It is important for marketing professionals to understand a company's values and culture. The following data are From an experiment designed to investigate the perception of corporate ethical values among individuals specializing in marketing (higher scores indicate higher ethical values). Marketing Managers Marketing Research Advertising 8 10 11 7 10 12 6 9 11 7 9 10 8 10 11 6 9 11 a. Use a = 0.05 to test for a Significant difference in perception among the three groups. Compute the values identified below (to 2 deCImals, if necessary). Sum of Squares, Treatment 49 @- Sum of Squares, Error 7.5 @- Mean Squares, Treatment 24.5 @- Mean Squares, Error 0.5 @- Calculate the value of the test statistic (to 2 deamals). 49 The prvalue is l between 01125 and p.05 v| 0
Step by Step Solution
There are 3 Steps involved in it

Get step-by-step solutions from verified subject matter experts