

Question: 1 a ) Run the baseline simulator & generate a plot Here's an example of how to run the simulator for a few timesteps. In
a Run the baseline simulator & generate a plot
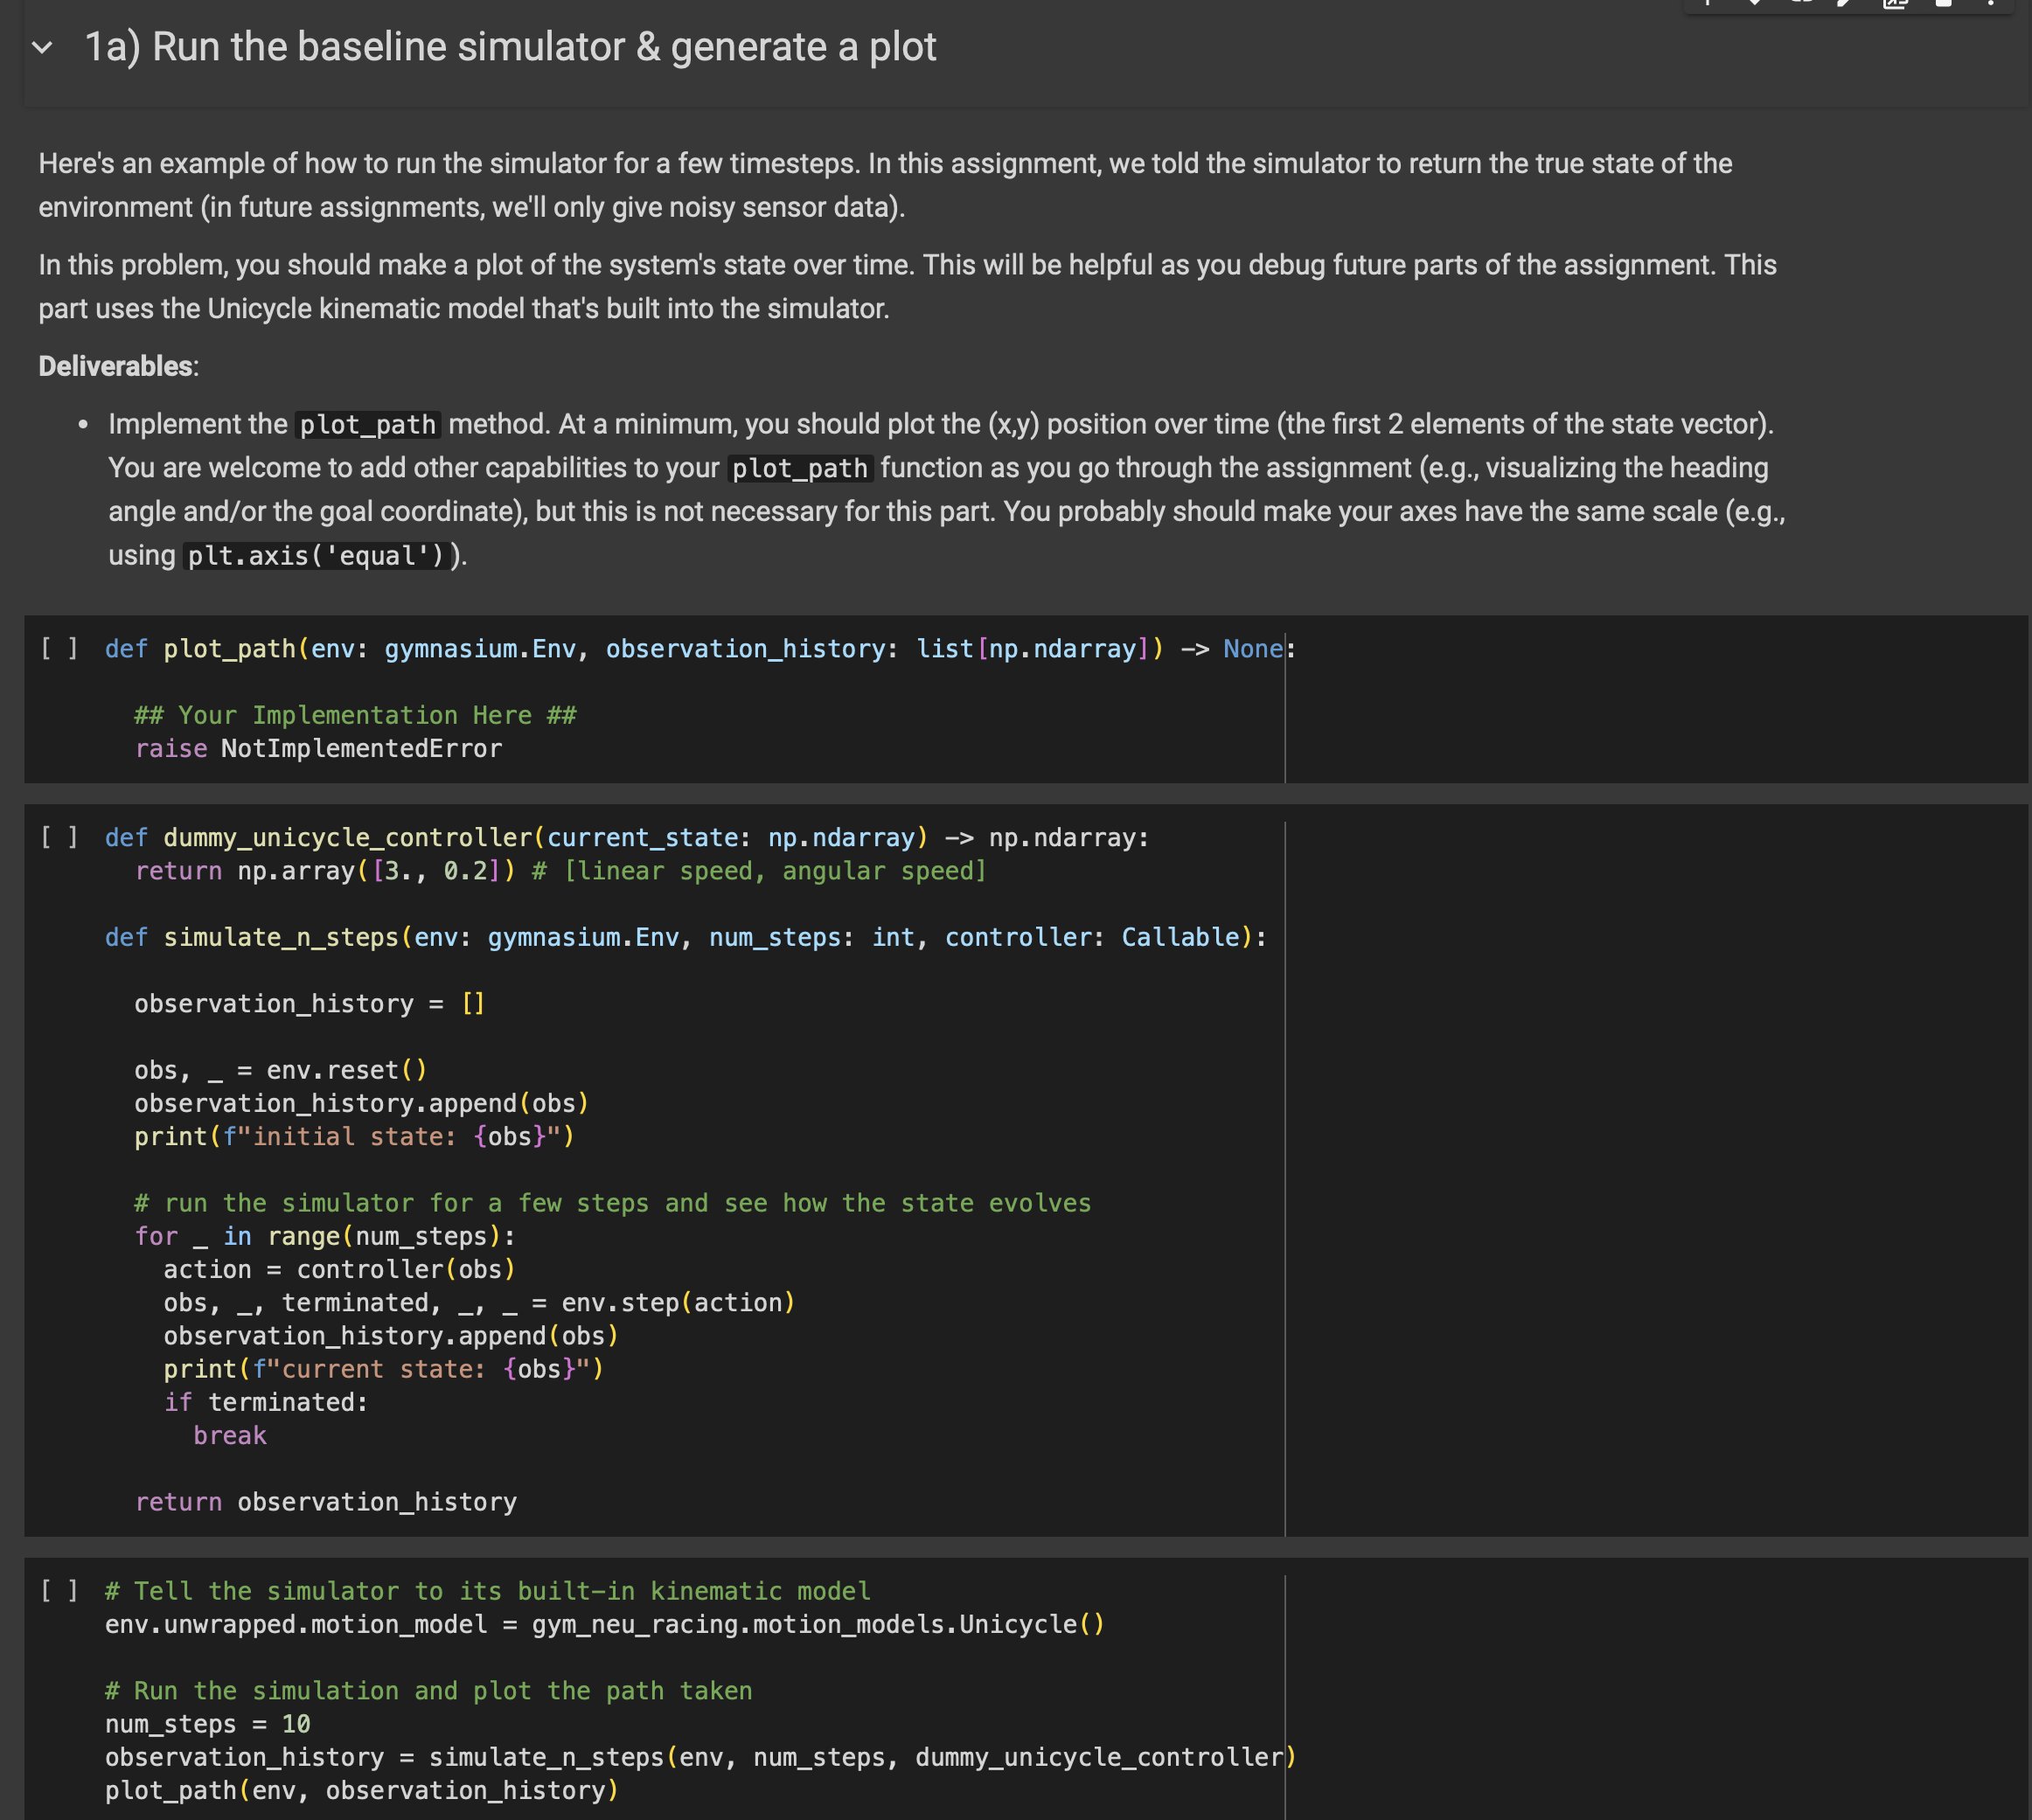
Here's an example of how to run the simulator for a few timesteps. In this assignment, we told the simulator to return the true state of the
environment in future assignments, we'll only give noisy sensor data
In this problem, you should make a plot of the system's state over time. This will be helpful as you debug future parts of the assignment. This
part uses the Unicycle kinematic model that's built into the simulator.
Deliverables:
Implement the plotpath method. At a minimum, you should plot the position over time the first elements of the state vector
You are welcome to add other capabilities to your plotpath function as you go through the assignment eg visualizing the heading
angle andor the goal coordinate but this is not necessary for this part. You probably should make your axes have the same scale eg
using pltaxis equal
def plotpathenv: gymnasium.Env, observationhistory: listnpndarray None:
## Your Implementation Here ##
raise NotImplementedError
def dummyunicyclecontrollercurrentstate: npndarray npndarray:
return nparray # linear speed, angular speed
def simulatenstepsenv: gymnasium.Env, numsteps: int, controller: Callable:
observationhistory
observationhistory.append obs
printfinitial state: obs
# run the simulator for a few steps and see how the state evolves
for in range numsteps:
action controllerobs
obs, terminated, env.stepaction
observationhistory.append obs
print fcurrent state: obs
if terminated:
break
return observationhistory
# Tell the simulator to its builtin kinematic model
env.unwrapped. motionmodel gymneuracing. motionmodels.Unicycle
# Run the simulation and plot the path taken
numsteps
observationhistory simulatenstepsenv numsteps, dummyunicyclecontroller
plotpathenv observationhistory
Step by Step Solution
There are 3 Steps involved in it
1 Expert Approved Answer
Step: 1 Unlock

Question Has Been Solved by an Expert!
Get step-by-step solutions from verified subject matter experts
Step: 2 Unlock
Step: 3 Unlock