

Question: 1. A small town is trying to decide whether to build a new water filtration system for its public water supply. There are two districts
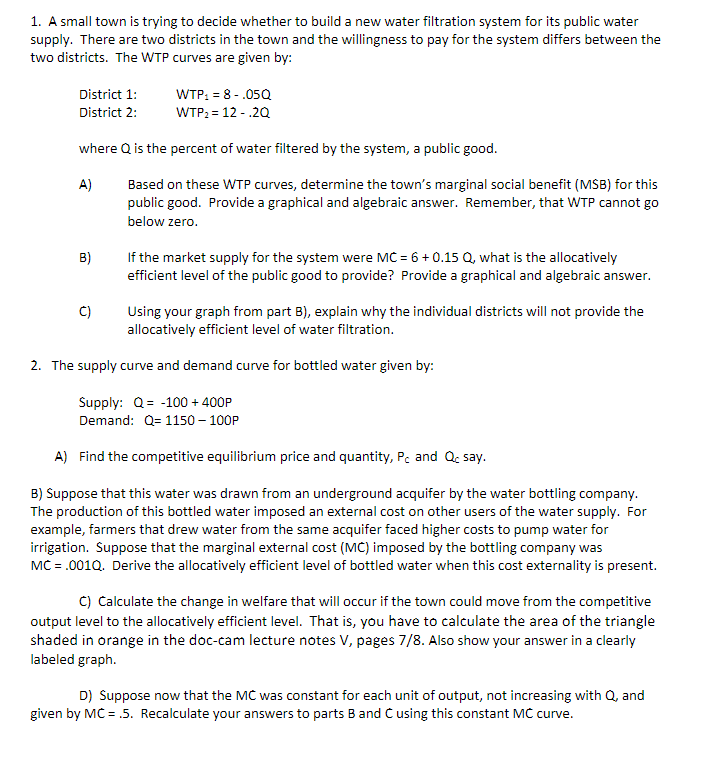
1. A small town is trying to decide whether to build a new water filtration system for its public water supply. There are two districts in the town and the willingness to pay for the system differs between the two districts. The WTP curves are given by: District 1: WTP1 = 8 - .050 District 2: WTP2 = 12 - .20 where Q is the percent of water filtered by the system, a public good. A) Based on these WTP curves, determine the town's marginal social benefit (MSB) for this public good. Provide a graphical and algebraic answer. Remember, that WTP cannot go below zero. B) If the market supply for the system were MC = 6+ 0.15 Q, what is the allocationly efficient level of the public good to provide? Provide a graphical and algebraic answer. C) Using your graph from part B), explain why the individual districts will not provide the allocationy efficient level of water filtration. 2. The supply curve and demand curve for bottled water given by: Supply: Q= -100 + 400P Demand: Q= 1150 -100P A) Find the competitive equilibrium price and quantity, Pc and Q. say. B) Suppose that this water was drawn from an underground acquifer by the water bottling company. The production of this bottled water imposed an external cost on other users of the water supply. For example, farmers that drew water from the same acquifer faced higher costs to pump water for irrigation. Suppose that the marginal external cost (MC) imposed by the bottling company was MC = .0010. Derive the allocationficient level of bottled water when this cost externality is present. C) Calculate the change in welfare that will occur if the town could move from the competitive output level to the allocationy efficient level. That is, you have to calculate the area of the triangle shaded in orange in the doc-cam lecture notes V, pages 7/8. Also show your answer in a clearly labeled graph. D) Suppose now that the MC was constant for each unit of output, not increasing with Q, and given by MC = .5. Recalculate your answers to parts B and C using this constant MC curve
Step by Step Solution
There are 3 Steps involved in it

Get step-by-step solutions from verified subject matter experts