

Question: 1. A sociologist was interested in measuring the link between people's health and the neighborhood they live in. 550 people were randomly selected from around

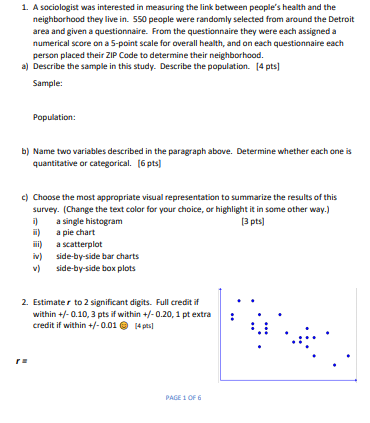
1. A sociologist was interested in measuring the link between people's health and the neighborhood they live in. 550 people were randomly selected from around the Detroit area and given a questionnaire. From the questionnaire they were each assigned a numerical score on a 5-point scale for overall health, and on each questionnaire each person placed their ZIP Code to determine their neighborhood. 2) Describe the sample in this study. Describe the population. [4 pts] Sample: Population: b) Name two variables described in the paragraph above. Determine whether each one is quantitative or categorical. [6 pts] c) Choose the most appropriate visual representation to summarize the results of this survey. [Change the text color for your choice, or highlight it in some other way.) a single histogram [3 pts] a pie chart a scatterplot side-by-side bar charts side-by-side box plots 2. Estimate r to 2 significant digits. Full credit if within +/- 0.10, 3 pts if within +/- 0.20, 1 pt extra credit if within +/- 0.01 () [4pa] PAGE 1 OF 6
Step by Step Solution
There are 3 Steps involved in it

Get step-by-step solutions from verified subject matter experts